
This article is a guest post by Alex Sirota of NewPath Consulting. It was entered into The Hackies essay contest for the upcoming MarTech conference. Like it? You can register your vote in the contest by sharing it on social media, especially LinkedIn, Facebook, and Twitter.
In Out of the Crisis, page 121, Dr. Edward Deming states:
The most important figures that one needs for management are unknown or unknowable, but successful management must nevertheless take account of them.
Deming realized that many important things, that must be managed, cannot be measured. You can’t measure everything important to management, and yet you must still manage those important things. But figuring out what is important to measure, and effectively doing so is as painful today as ever. Effective digital transformation depends on measuring the things important to your customers, not to just your executive management and staff.
Fundamentally changing a business strategy requires some difficult and controversial choices. How can we make effective decisions in a world of constant noise and disruption? We need to observe and measure what customers and organization staff actually do, not what their biases dictate.
Data Access is Sacrosanct
Today, most key business performance data is stored in structured and unstructured formats on internally-managed infrastructure. The most important decisions are made using information stored in spreadsheets, presentations and in various proprietary data formats designed to keep data secure and inaccessible by most staff.
Data access is sacrosanct and business users have to go through a set of data priests guarding information fiefdoms to get it. If you want to see an integrated view of all business metrics, you have to build a “Key Performance Indicators (KPI) Dashboard.”
Been There, Done That: Excel Dashboard Hell
The creation of the KPI dashboard involves blessing from IT and buy-in from the business owners of the data. All are involved in a massive project to export, transform and load data (ETL) into a data warehouse.
These projects are expensive, and only the companies with large resources can undertake this strategic but critical work. Production enterprise resource planning (ERP) systems, marketing and sales systems (e.g. CRM), financial and accounting systems, and customer service systems feed a data warehouse that theoretically will provide a complete picture of overall business health.
The dashboard, usually fed from other underlying intermediate data sources, informs the CEO accountable to a “bottom line” and controlled by the CFO who reports financial results. Downstream individual lines of business use more granular dashboards to understand various revenue and cost drivers to respond to pressures and take advantage of opportunities.
When successful, these projects can predict when a business model is working and provide insight to strategic decisions.
Most of the time though, these projects are departmental, designed by sales, marketing or operational teams. To collect the data across an enterprise, spreadsheets become the lingua franca, usually out of date, maintained by business owners and their Excel-minions. The data in a spreadsheet is usually laced with bias from the people who supply the data. Or worse, they are laden with inaccuracies or incompleteness due to the various transformations and inadequacies of the underlying data warehouse.
Cloud-enabled Microservices Transform Business Intelligence
As business applications move into the cloud, so too does the data that needs to be analyzed. But with the disaggregation of IT services around business capabilities into hundreds or even thousands of cloud “microservices” what does the data challenge begin to look like?
It looks absolutely terrifying and chaotic.
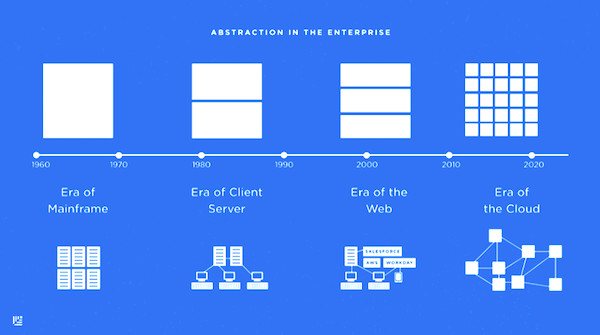
The “Era of the Cloud” (diagram from Matt Miller of Sequoia Capital) has a critical feature that makes sense of the potential chaos: each service has an underlying data model that is abstracted by an easily accessible API.
Because APIs are a critical component of integration between cloud services, they are also a ready made data tap for a modern cloud-enabled data warehouse. In fact the quality and stability of the API, and the ability to get direct access to transactional, non-summarized data is a differentiation point when selecting cloud services.
A new type of data is commonly also available — “meta data” that measures every transaction whether it be an anonymous click on a website or even the usage and telemetry data from an application user interface. Cloud services collect an extraordinary amount of data, much of it collected as “exhaust” data and recorded by computers rather than forgotten by people. This new type of data, stored for of pennies per terabyte, can point to performance indicators that have never been available before.
Answering Two Holy Grail Business Questions
How do you identify your most profitable customers and segments?
How do you attract more customers like them?
These two questions sum up the “bottom line” of most business models. Yet many businesses, large or small, are not positioned to answer them. They rarely have the necessary analytics in place to inform a decision maker whether or not their current business strategy is working or where improvements are in order.
Until recently, answering these type of questions could be prohibitively expensive and maybe even impossible. But keep these two questions in mind as we build an enterprise running entirely on API-enabled cloud services using a “data pipeline” and pose a set of underlying intermediate questions than can inform the answers to our two core questions.
- How much revenue do we generate by customer segment? How much cost do we have by each customer segment? How quickly can we analyze different segments of our customers? (Source: financial + CRM)
- What is our advertising ROI by channel? (Source: web and ad analytics, including external vendor)
- Are our customer success efforts affecting our churn rate? Can we optimize our customer support efforts? (Source: customer support + web application analytics)
- Are our sales people talking to the right target customer? Are there other prospects we are missing? (Source: CRM + marketing)
- How effective are our staff at innovation? How quickly can staff ramp up to be effective after hiring? How are they learning on the job? (Source: is there a system for this at all in organizations?)
We will need to centralize these data sources so that our business intelligence tool can draw from one aggregate pool of data that’s consistently updated. We will also need to automatically maintain a data dictionary and identify common identifiers shared between systems (e.g., an email address to identify a customer between pre- and post-sales systems).
Cloud Enabled Business Intelligence State of the Art
At NewPath Consulting we have researched the creation of cloud-based business dashboards since 2014. Cloud-based systems each have their own data silos, as illustrated below:
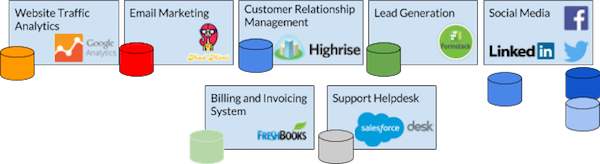
Each cloud-based system has its own way of doing data analysis, usually very limited. In many ways, the cloud-based data problem is a lot more complex, because the proliferation of data silos is even more intense in the cloud than it was when data resided in several, on-premise proprietary systems and documents repositories.
The saving grace to the cloud data problem is two-fold:
- All cloud applications are designed with a REST API, that allows the programmatic, real-time extraction of data.
- A new breed of data pipeline and visualization companies have developed highly effective tools democratizing data access and analysis.
Creating the Cloud-Enabled Data Warehouse
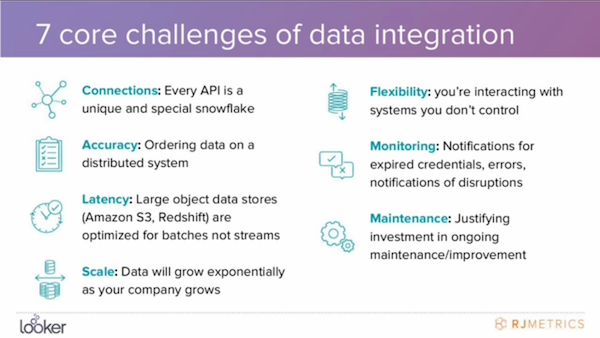
The following graphic from a Looker and RJ Metrics presentation illustrates several technical challenges of data integration common to all cloud data warehousing projects:
Web traffic, distribution and online goal data can be managed in Google Analytics for example, but what about transactional data? How do you manage the data about the journey from an anonymous prospect to a long-term, profitable customer? And how could a business determine if a customer is profitable if measures of profitability have to come from multiple systems?
This is the core business problem in any business intelligence system — creating the necessary underlying relationships between various data sets.
At NewPath Consulting, customer profitability is dictated by:
- Cost of customer acquisition
- Number of customer service requests
- Number and length of longer term implementation or maintenance projects
- Underlying software and human resources needed to service those requests
The data to support these indicators post-sales can be tied together between systems easily: the email address(es) that the customer uses across multiple operational cloud services. In a pre-sales scenario we must count in aggregate, but customers decloak from anonymity with a direct interaction by phone or email or some other traceable identifier such as a web cookie or customer ID.
Data Pipelines to the Rescue
New tools such as Stitch, Alooma, Xplenty and Fivetran and even open-source solutions allow real-time “copy and paste” and “synchronize” of multiple cloud data sources into a cloud data warehouse, so it can be manipulated and visualized in many ways.
Visualization tools like Looker coupled with data pipelines make the building of a data warehouse a snap. Even G Suite add-ons such as Supermetrics can populate a Google Sheet to create a DIY cloud business intelligence system for SMBs.
NewPath Consulting has started to put together a content marketing dashboard using Google Analytics data to analyze daily, monthly and yearly trends in our content marketing efforts. We have also integrated our billing system into a steady stream of expense and customer payment data.
It is a satisfying experience to spin up a fully configured data warehouse in the cloud with a few clicks and in minutes start pumping raw data from multiple cloud sources manipulated through tried and true object/relational techniques.
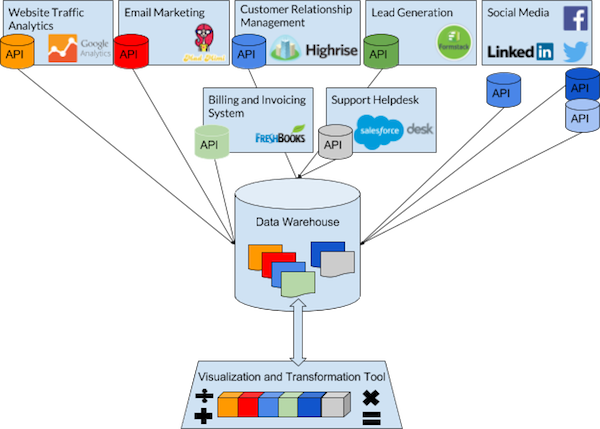
Here’s an illustration of how these new data pipeline tools enable a totally new degree of analysis composed of a myriad of cloud-based data sources:
In addition to providing fantastic visualization and reporting functionality, modern business intelligence tools often have a modeling layer as well that allows users to perform joins/transformations as needed.
Unlike in traditional ETL (extract, transform and load) systems, transformation is performed after the loading step (i.e., ELT — extract, load, then transform). The benefit is that the end-users — the ones who primarily work with the data — have a lot more power and access to raw data, and don’t have to depend on IT to accomplish the analysis they need.
Four Business Intelligence Futures
So where do we go from here? We believe there are four innovations on the horizon for businesses and the people that operate them:
Data citizens, unite. The democratization of cloud-based raw data, delivered through the immense compute and storage capability of cloud data warehouses like AWS Redshift will open up access to users beyond data scientists. Business users will become data citizens and end the reign of data priests and information fiefdoms.
Unlimited access to raw, unfiltered customer-oriented data. The transformation from an ETL to an ELT model will enable direct access not only to summarized data (e.g., Google Analytics dimensions and metrics) but also to customer behavioral and transactional data as well as exhaust “meta data.”
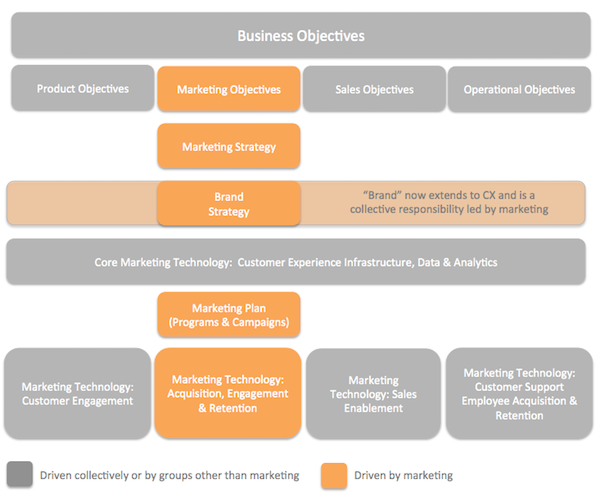
Business model canvas-on-steroids. The metrics to measure each part of a business model can be evidence based (rather than assumptive or intuitive), supported with key performance indicators, summarized in real-time from hundreds of disparate cloud based data sources.
The cloud-enabled business advisor. Imagine the ultimate solution to the CEO’s job of making better business decisions: a cloud-enabled, AI-powered advisor. When will an intelligent, virtual business advisor begin to whisper into the CEO’s ear with recommendations around potential acquisitions, resource reallocations, pricing adjustments, and structural reorganizations?
If you want to be kept up to date on this project, please let us know, and we’ll put you on a notification list.
What did you think of this article as an entry in The Hackies essay contest for the upcoming MarTech conference? If you liked it, you can register your vote in the contest by sharing it on LinkedIn, Facebook, and Twitter.
Have a marketing/technology/management “hack” that you want to share with the world? Consider entering The Hackies yourself — we’d love to learn from your experience and insight!

Thanks Scott for publishing my thoughts and experiments. A quick note — the first diagram on abstraction of the enterprise comes from Sequoia Capital’s Matt Miller’s excellent piece on microservices:
https://www.sequoiacap.com/article/build-us-microservices/
Thanks, Alex — I’ve updated the post to include that citation!
Vint Cerf echos my sentiments very eloquently during his fireside chat with Marc Andreesen at Google Cloud Next ’17. https://youtu.be/y9bJ8LslSZ4?t=906
Just annonced: Singer.io from Stitch Data — an open source project to tap into data through APIs of martech services.
https://www.singer.io
Another ETL provider to consider, especially if you want to “build a data warehouse [in] a snap,” is Etleap (https://etleap.com). Anyone — including analysts and marketers — can set up data transformations using a visual data wrangler, without writing any code. Makes things flexible yet easy. Here’s a perspective on the available ETL options from a BI company: https://blog.modeanalytics.com/etl-tools-analytics-stack/