
This article is a guest post by Christopher Penn of SHIFT Communications. It was entered into The Hackies essay contest for the upcoming MarTech conference. Like it? You can register your vote in the contest by sharing it on social media, especially LinkedIn, Facebook, and Twitter.
The Challenge
Historically, content marketers and communicators have been frustrated by separate, disconnected content marketing analytics. We have different systems to measure SEO, social sharing, engagement, and quality of content.
We know our efforts pay multiple dividends across channels but lack a single tool that puts everything together in one holistic view. The consequence of these organizational and data silos is disconnected data, data which cannot be used to create strategic insights or address cross-channel marketing problems.
The Idea
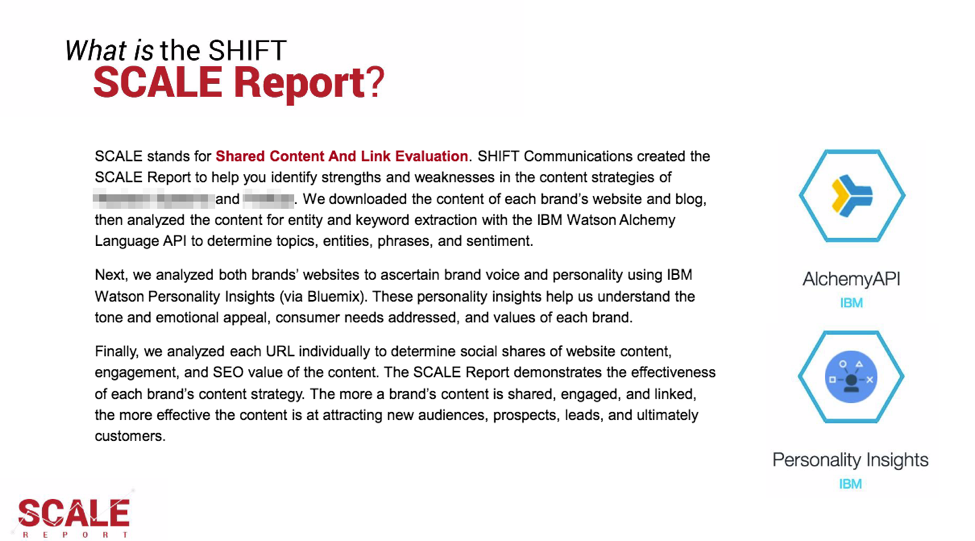
SHIFT created SCALE to solve this problem. SCALE, short for Shared Content And Link Evaluation, is a cloud-based software package designed to ingest URL-based marketing data from multiple, disparate data sources, unify the data, and, leveraging best-in-class analytics engines such as Tableau and IBM Watson Analytics, provide actionable insights from data.
With SCALE, organizations can ascertain not only the effectiveness of earned media hits for themselves, but also gain competitive insights about what content resonates on competitors’ owned and earned media properties.
The Execution
SCALE was built on an open source platform with MySQL, PHP 7 and ubuntu linux. It pulls organic search marketing data from the MOZ Open Site Explorer API and SEMRush. as well as multiple social APIs, including: Facebook, LinkedIn, Pinterest, Reddit, Stumble Upon and Google+.
SCALE also includes readability data via an open-source PHP implementation of the Flesch-Kincaid readability algorithm.
The first iteration of SCALE was for social scanning only. You would feed in URLs and receive an output of how many times that URL had been shared on social. We quickly realized, however, that such information was only part of the big-picture answer. Over time, we’ve continued to iterate and improve the product. After becoming founding members of IBM Watson’s Key Opinion Leader Program, we again iterated on SCALE to provide a new layer of qualitative context to our quantitative output.
In addition to ingesting multiple data sources, SCALE includes a series of ETL processes. Upon import, data from various APIs is normalized and cleaned; for example, many APIs use different timestamps to record dates. After cleaning, data is imported in the database, and a 41-step automated process transforms it into a denormalized warehouse. Once denormalized, the SCALE data is extracted either by script or by analysts, then analyzed, formatted, and prepared for client usage.
User Benefits
Using SCALE, organizations enjoy one or more of the following benefits:
- Earned media: Organizations can identify which coverage creates the most social engagement, provides the greatest organic search benefit, or shows the highest content engagement rate. Organizations can then tunes their efforts based on these findings.
- Owned media: Organizations can identify which website and owned digital property content resonates the most, which is the most well-rounded, and which is underperforming. Clients can then repair poorly performing content to reap greater digital marketing ROI.
- Competitive analysis: Organizations can determine which subjects, topics, and content resonate most with their target audiences compared to competitors, then adjust their content marketing program to mitigate competitive threats or seize opportunities.
Depending on the depth of each SCALE report, the Customer Journey to Online Purchase, via Google’s data science team, Think With Google, can also be used to provide additional context and recommendations. This tool identifies how customers of companies of various side and industries use digital channels to become aware of them, learn more about them, and engage with them.
For example, in the image below, customers first learn about a company on the far left, interact with them in the middle, and eventually buy from them on the right. The colored circles indicate which channels they use; when stacked, they use those channels simultaneously. So, if we were to run a SCALE report for a large company in the industrial space and determine they had a tentpole SEO strategy and virtually no social shares, we’d recommend they improve and diversify owned and social content.

SCALE: Example
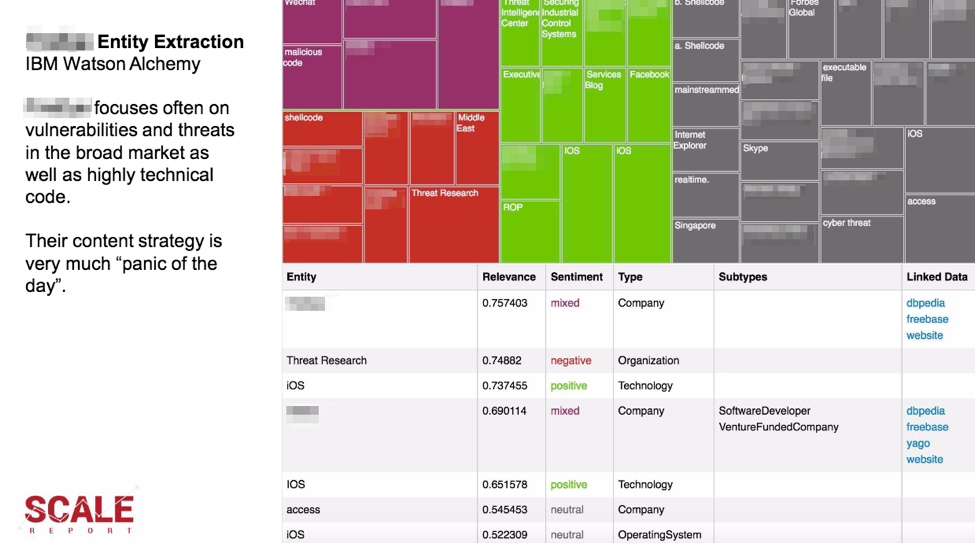
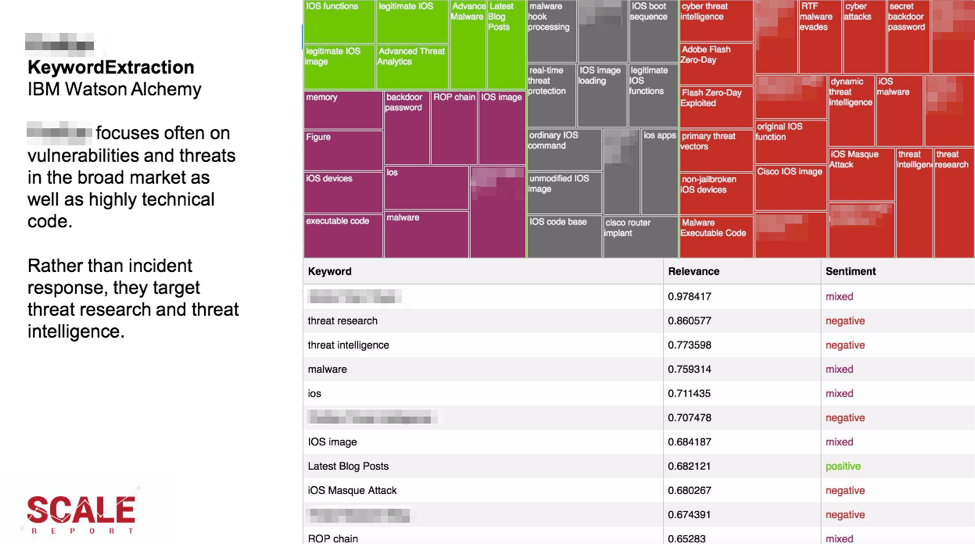
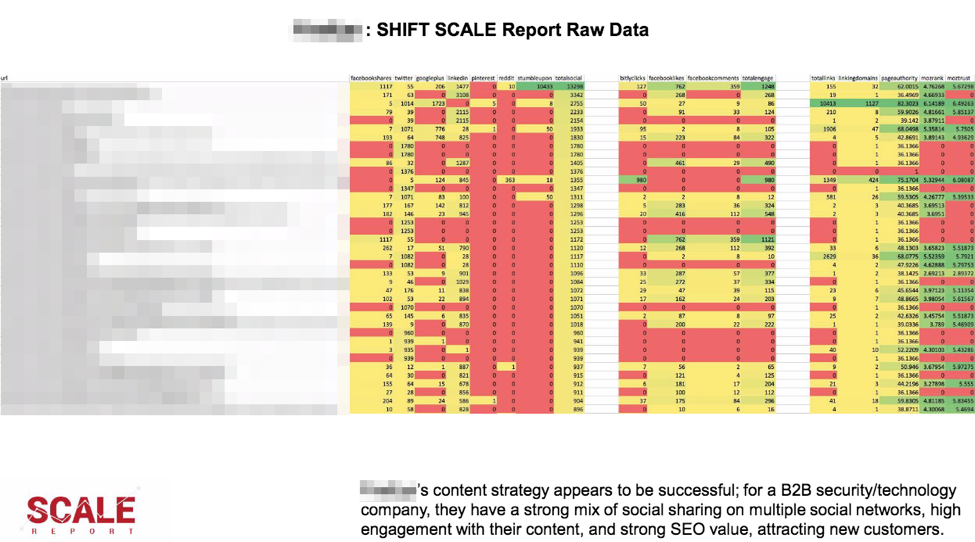
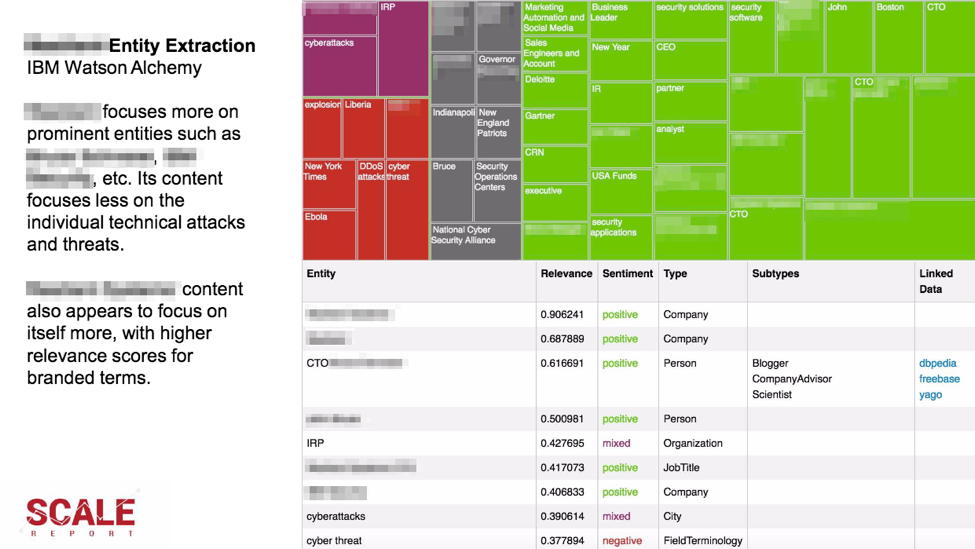
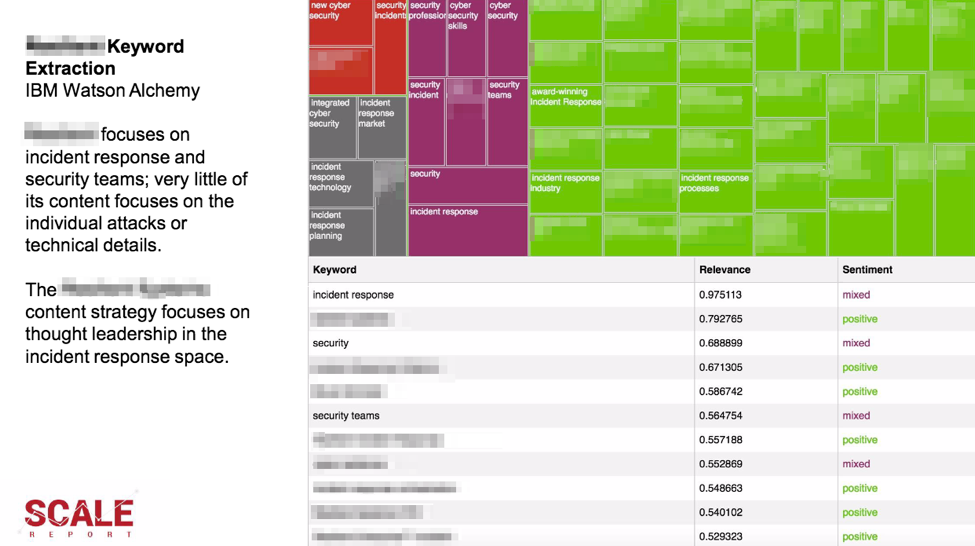
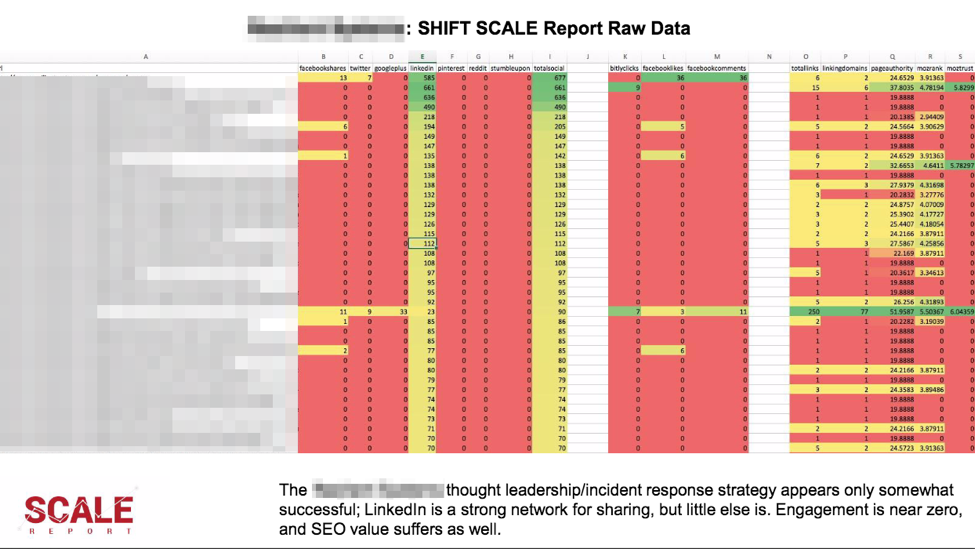
Below, please find a sample, sanitized SCALE report of comparing two large B2B security companies.
Vendor A
Vendor B
What did you think of this article as an entry in The Hackies essay contest for the upcoming MarTech conference? If you liked it, you can register your vote in the contest by sharing it on LinkedIn, Facebook, and Twitter.
Get chiefmartec in your inbox
Join 42,000+ marketers and martech professionals who get my latest insights and analysis.