
People often complain that my marketing technology landscape has too many apps. If only those crazy martech entrepreneurs would stop making more, all would be right in the jungle.
Let’s set aside for a moment the supply-side economics that have fostered this app-a-palooza, e.g., cheap infrastructure in the cloud, a plethora of great open source foundations, worldwide developer talent on demand, etc. While those factors have created a world where there are now near zero barriers to entry for building a software product, you still can’t have a market without both supply and demand.
So this multitude of apps — more every year — thrives for two other reasons:
- Demand — people keep buying more apps.
- Efficiency — new software solutions and “platforms” keep making it easier for people to adopt more apps by steadily solving the problems around integrating and managing multiple, best-of-breed apps.
Which brings me to a couple of excellent reports by two different vendors helping to make the multi-app, best-of-breed world a little more friendly and efficient: Okta and Blissfully. Okta handles single sign-on (SSO) across apps, and Blissfully manages SaaS subscriptions, primarily for SMBs. Their respective reports:
Blissfully 2019 Annual SaaS Trends Report
I’ll discuss more below about why these two companies have access to unique “hard data” on SaaS tech stacks and how they help make large, heterogenous stacks more efficient. But let’s start with the key takeaways…
1. Companies of all sizes continue to use more apps.

The chart above from Blissfully’s report sums it up: businesses of all sizes are using dozens to hundreds of SaaS apps each. Even really small businesses, with fewer than 50 employees, have 40 SaaS apps on average.
Triangulating this, we can see from the bar chart below from Okta’s report that the number of apps they connect inside a company has been growing steadily over the past 4 years:
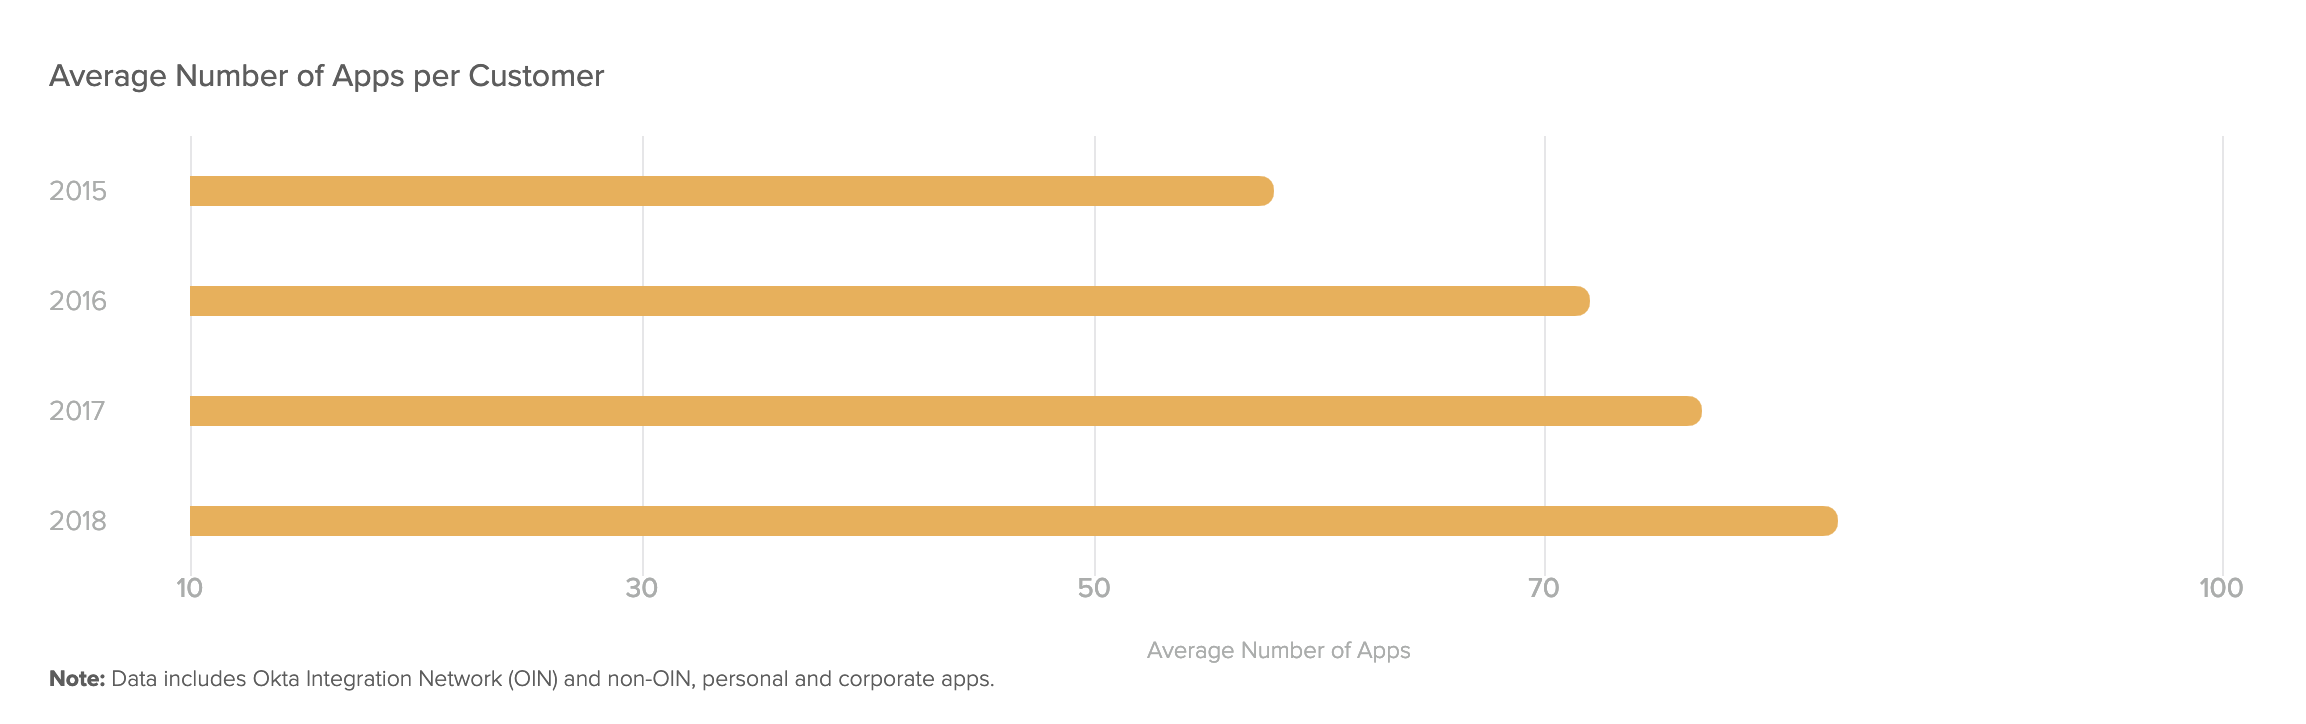
Quoting their report, “In the past four years, large customers have increased their app usage by 68%, now averaging 129 apps per customer in 2018. Small to mid-sized companies have also dialed up their app usage at a 38% growth rate, now averaging 73 apps per customer.”
For Okta, small to mid-sized companies are firms with fewer than 2,000 employees.
You might be wondering why the number of apps reported by Okta is smaller than the number from Blissfully. It has to do with the way they collect this information. Okta is measuring apps that are connected through their single sign-on (SSO) service, which is usually only a subset of the total apps used in a company. But they keep connecting more every year.
Blissfully, on the other hand, counts app subscriptions by looking at data from a variety of data sources. This includes SSO sign-ons through services such as Okta, but also by monitoring vendor communications and interactions in G-Suite and checking actual subscription bills in accounting systems such as QuickBooks, NetSuite, and Xero.
This gives Blissfully a more complete view of the apps used inside a company — although it’s still possible for other apps to sneak through. In other words, the number of apps reported by Blissfully is a highly accurate floor of stack sizes, but the ceiling could be even higher.
2. This phenomenon isn’t limited to marketing and martech.
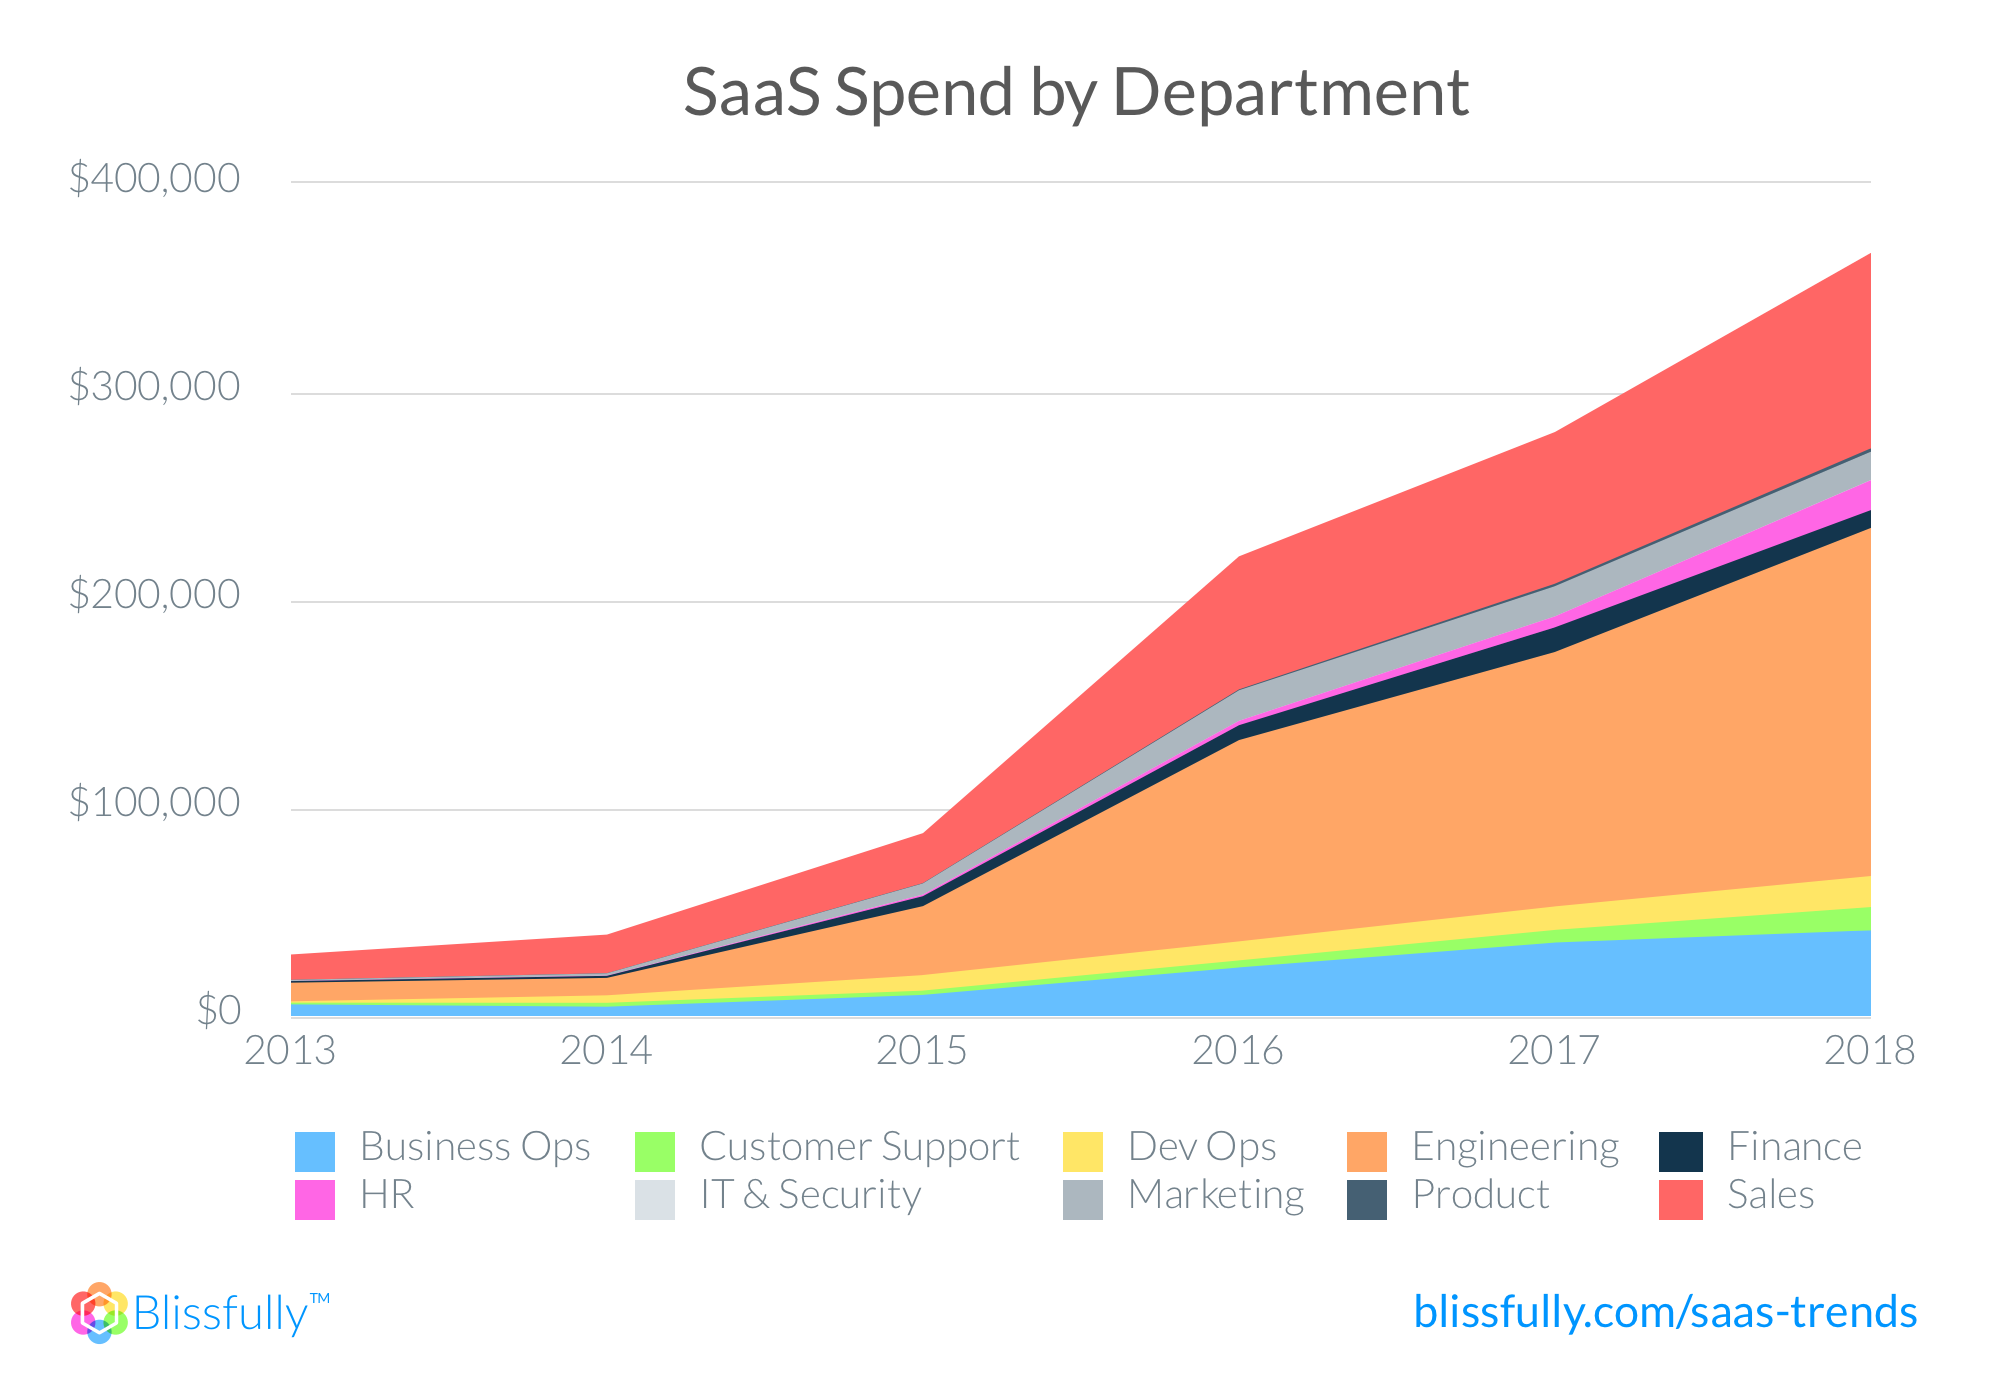
It’s not just martech. The data from both Okta and Blissfully show that the multi-app SaaS explosion is happening across every department: sales, HR, finance, IT, etc.
In fact, the graph above from Blissfully, which is the average growth in SaaS spend across all their customers — mostly SMBs, to frame the non-enterprise-y dollar amounts on the y-axis — shows that marketing (the thin gray bar) could be one of the smaller buyers of SaaS apps.
Of course, as Ben Legman at Blissfully pointed out to me in an email discussion, marketing users regularly use apps from many of these other categories, such as a CRM that may be officially listed as a “sales” app.
I also asked him about the large quantity of spend on “engineering.” This includes spend on cloud platforms such as AWS, Azure, and Google Cloud Platform. For companies that are SaaS businesses themselves, this includes the cost for running their products on those services, which likely skews the average in this graph.
However, as Ben pointed out, even businesses that aren’t pure SaaS companies are doing more and more software development. See my article last month on 3 trends of ecosystems, experts, and (citizen) engineers for an explanation of why we’ll only see more of this ahead.
3. Technology stacks are best-of-breed.
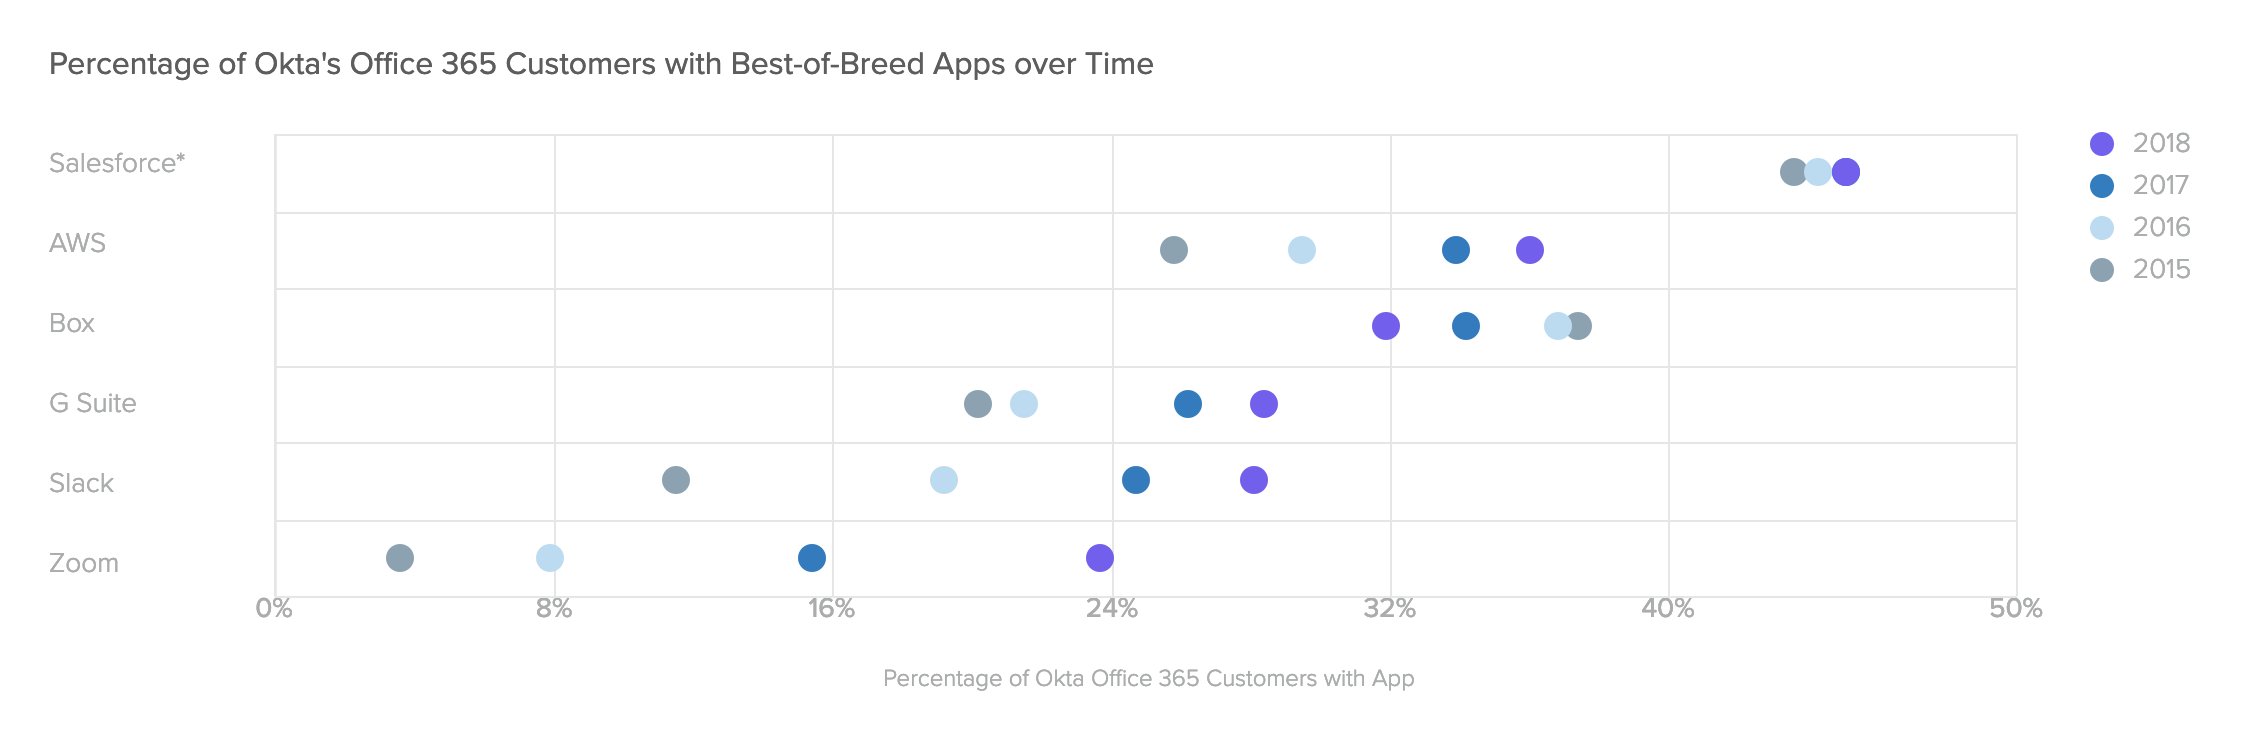
One of the insights that Okta confirmed in their report is that companies don’t standardize on a single vendor for all of their app needs. They mix-and-match apps across Microsoft, Google, Amazon, Salesforce, and an endless array of other SaaS vendors.
You can see from their graph above that all of the vendors they charted — many of whom compete with each other — are gaining greater adoption, with the exception of Box. You could argue Box is one of the more commoditizable capabilities. Yet it still holds ~32% share in Okta-managed stacks.
This is best-of-breed incarnate, and it is undeniably the new normal. For an official definition of “best-of-breed,” I’ll quote Okta’s report:
“How do we define ‘best-of-breed?’ Best-of-breed apps excel at performing specialized functions, whether or not they are part of an integrated system. We look to our rankings for most popular apps by number of customers and see that Salesforce, AWS, Box, Slack, and Zoom, each representing a different product category, are some of the most popular stand-alone apps, gaining our ‘best-of-breed’ designation.”
4. Individual users work with multiple apps.

Finally, the Blissfully report confirms something that seems obvious, but we can now quantify with hard data: users work with many different apps. For SMBs, the average is around 8 apps per user.
Blissfully rendered a fantastic visualization of how different users connect to different apps, to help one appreciate all the intertwined relationships:
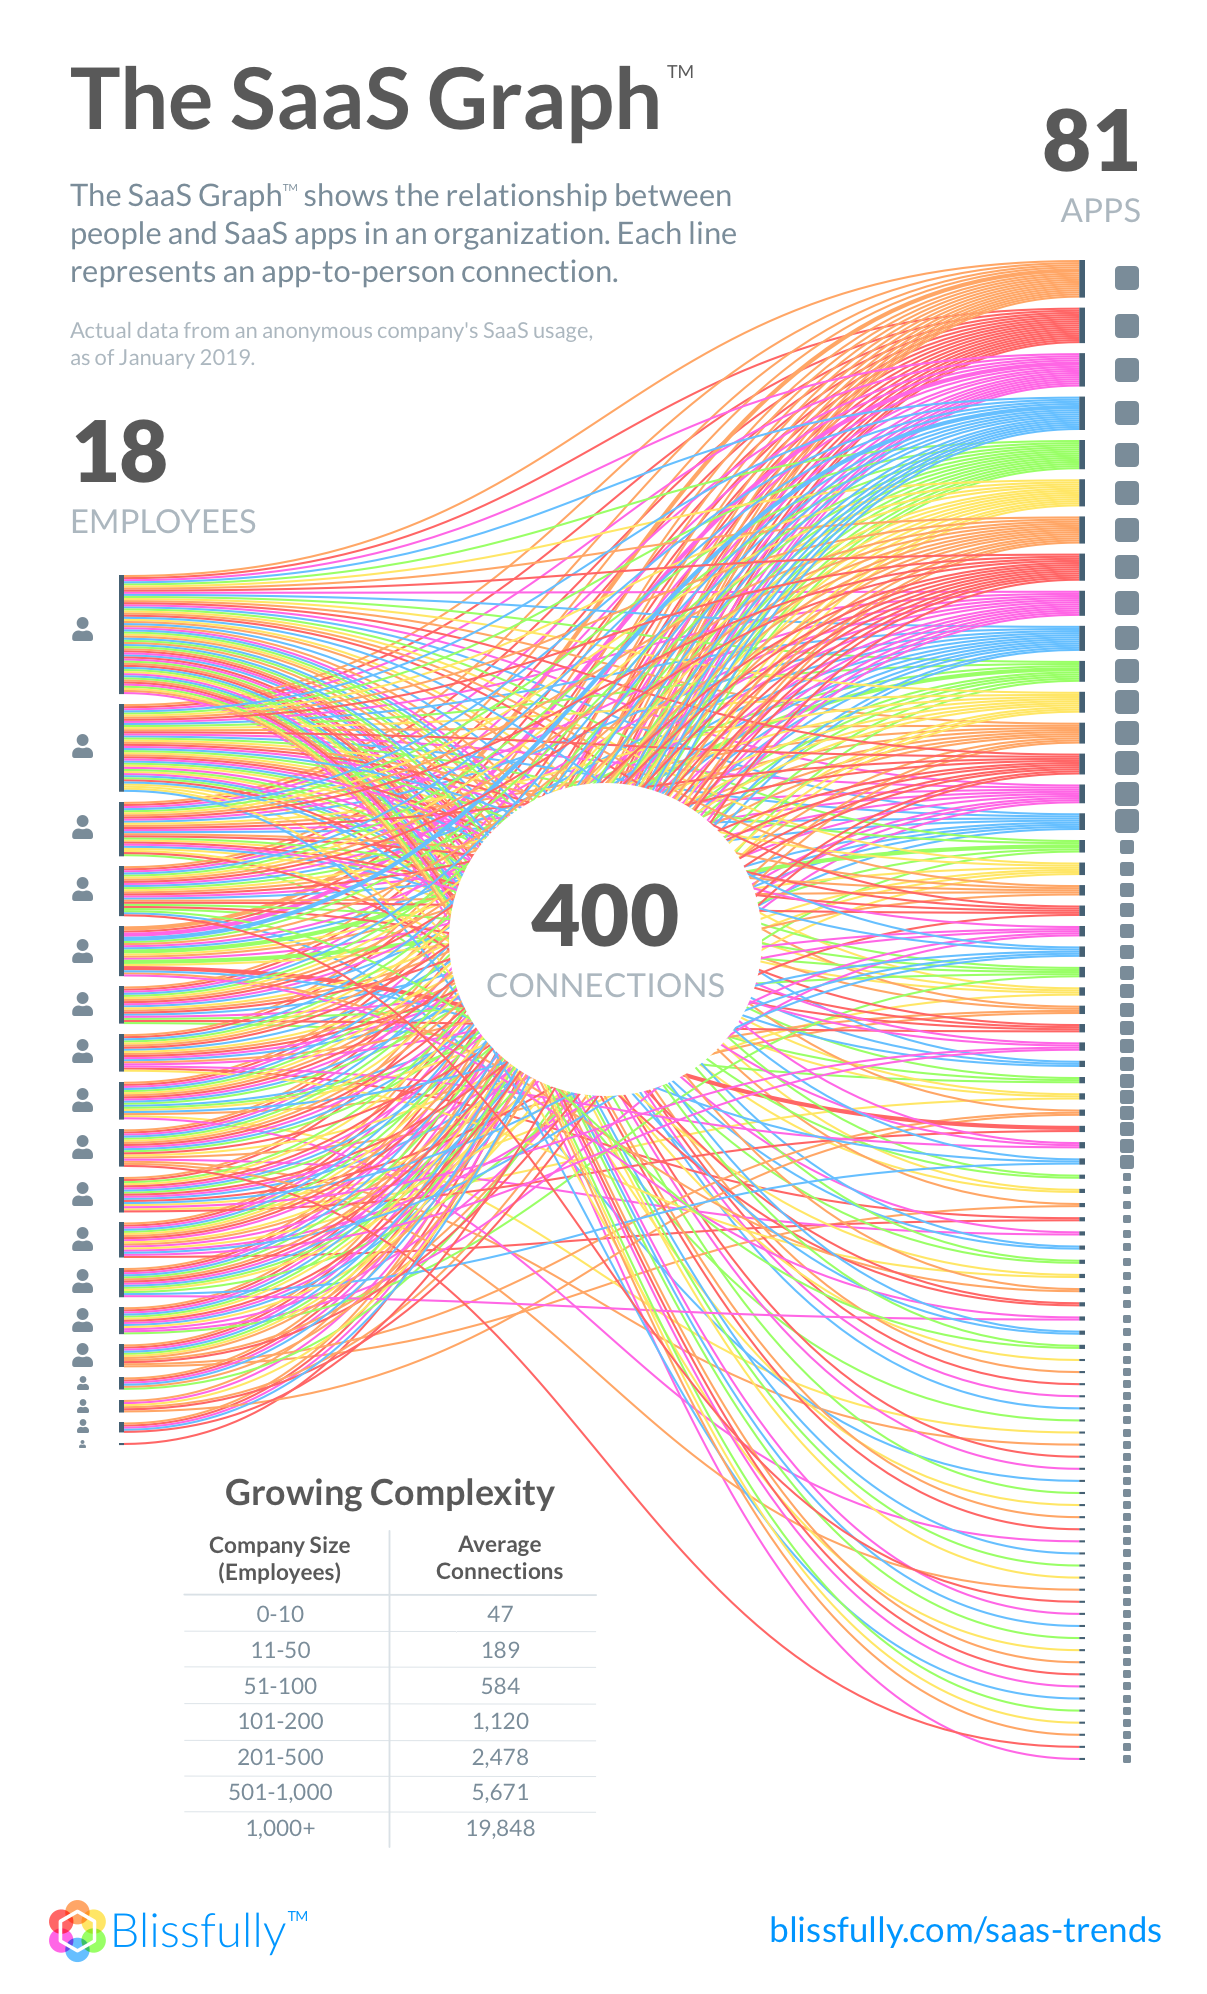
One of my takeaways is that this provides further evidence of the opportunity for better integrations between different apps. It supports the trend towards platform ecosystems.
I recently wrote a piece about the race to win the one-window test happening across many SaaS vendors such as Google, Dropbox, and GitHub.
Everyone is coming to acknowledge that it will be a multi-app, best-of-breed world for the foreseeable future. But there’s still opportunity to make the user experience of working with all these different apps better by letting users interact with them through one or two “primary” apps where they spend most of their time working in a consistent interface.
Apps will have more and more elements of their functionality accessible as embedded features within other apps. I believe there’s tremendous innovation ahead in this kind of UX integration between apps.
Why this “hard data” gets to the ground truth.
So a little more about the creators of these two reports and why the data above constitutes facts, not opinion.
Okta is a leading provider of workforce and customer identity solutions, such as managing single sign-on (SSO) across multiple apps within a business. This makes it easier for IT to control access to those apps, makes it easier for users to have to remember only a single account and password, and makes the whole stack considerably more secure with multi-factor authentication and centralized activity monitoring.
Blissfully, well, I like to think of them as “TripIt for SaaS.” You connect your email, accounting system, SSO login service, etc., to their service, and they keep track of all the SaaS subscriptions in your business through their notifications, invoices, logins, etc. Among other things, this helps identify duplicate or orphaned subscriptions across your business.
Okta makes it easier for you to have multiple apps from a security and account management perspective. Blissfully makes it easier for you to deal with multiple apps from an expense management perspective. Both are valuable to the expanding app economy.
But because they both measure actual apps installed — either by managing single sign-on for them or tracking their subscriptions — Okta and Blissfully are both able to report the “ground truth” of app adoption within companies. They know which apps people are actually logging into and which ones they’re actually paying for. It’s hard data based on what people do, in contrast to soft data from surveys based on what people say.
By the way, as a closing meta-thought: if you subscribe to Okta and Blissfully to help manage your growing tech stack, that’s also two more additions to your stack.
It is a multi-app, best-of-breed world.
P.S. Want to meet other martech professionals and learn about the best ways to extract value from your multi-app martech stack? Be sure to join us at the MarTech conference in the Bay Area, April 3-5. Discounted early bird “beta” ticket prices are available through March 2.
Disclosure: HubSpot, the company where I serve as VP platform ecosystem, is an investor in Blissfully.
Get chiefmartec in your inbox
Join 42,000+ marketers and martech professionals who get my latest insights and analysis.