Surveys are nice, but they have their limitations. They’re swayed by who participates (selection bias) and the way those participants interpret your questions in their own minds — which varies wildly for reasons a psychologist would be best suited to explain. The results can be directionally useful, but they’re not “facts.”
The ground truth is what people actually do, not what they say they do.
So I was thrilled to see the new Work Automation Index 2021 released by Workato last week, which reports aggregate data about what people at nearly 700 mid-size to large enterprises are actually automating on their platform.
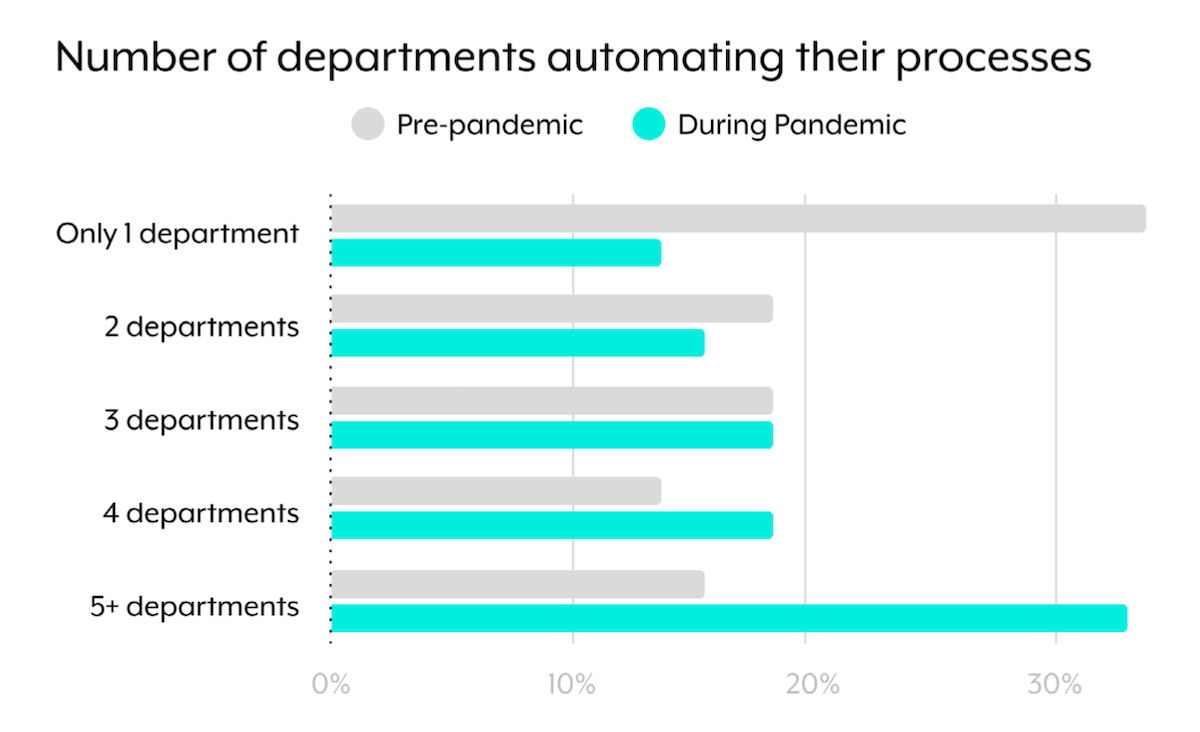
The data point that jumped out at me first was the chart above, showing the rapid spread of automation within companies during the pandemic. Before the pandemic, about 33% of these companies had only one department using their automation platform. Only 15% had 5 or more departments automated.
Fast forward to today. Catalyzed by the new environment for work and customer engagement in the pandemic, those numbers reversed themselves: now 1/3 of of companies have 5+ departments automating their processes. Only ~13% had only one department automated.
Intuitively, this makes sense. But it’s great to have hard data quantifying it.
It’s also good evidence for the case I’ve been making about aggregation over consolidation in martech, as tech stacks become almost virtual platforms. Workato is a great example of this dynamic: the more different software you have operating throughout your business, the more valuable Workato is in making it easy to automate processes across those different apps.
Two big interrelated themes in the era of Big Ops: automation and aggregation.
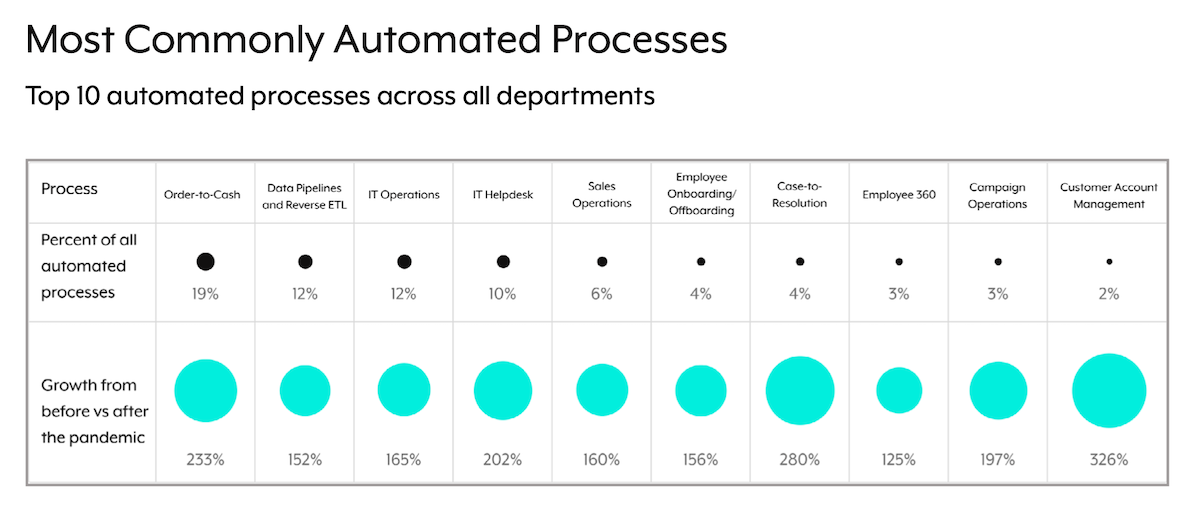
Workato’s report shows jumps in automation were triple-digits across a ton of use cases. These are the top 10 automated processes across all departments, showing their share of the overall automation pie and their growth from before vs. after the pandemic:
The top two? Order-to-cash and data pipelines. It’s almost the mantra for modern business: Flow the cash. Flow the data.
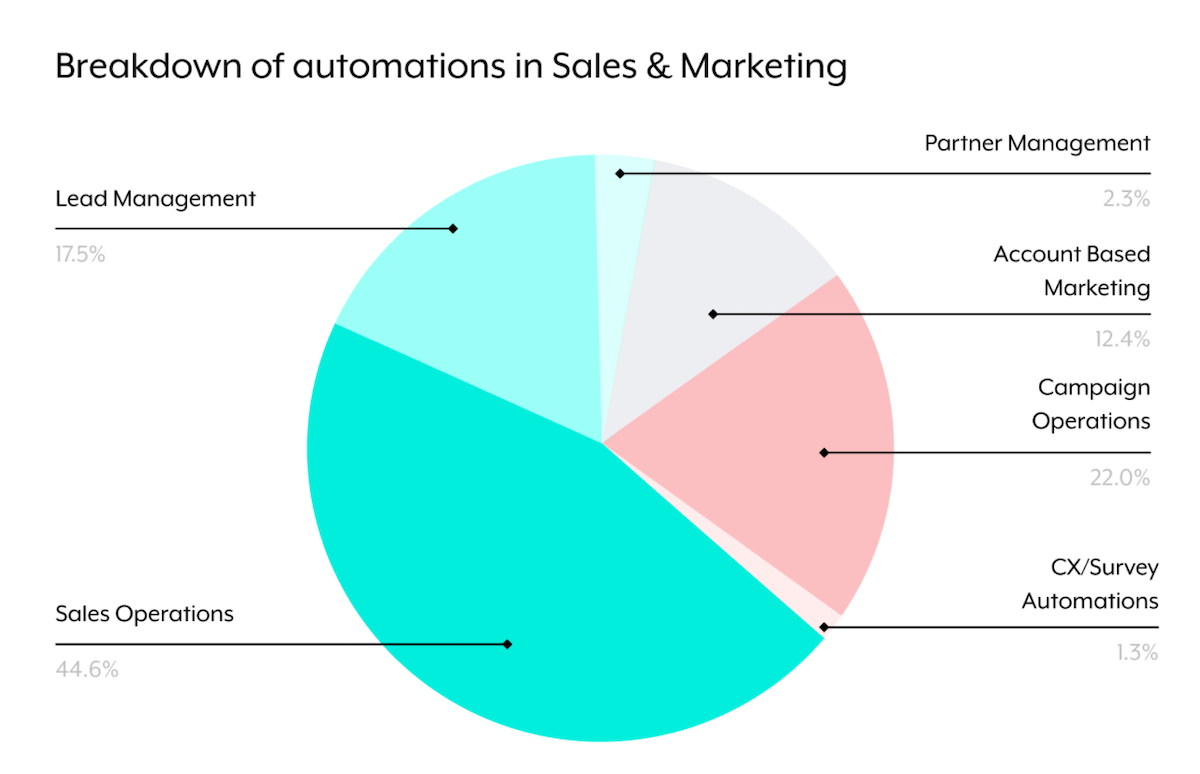
Of course, I’m most interested in marketing and sales use cases, so I appreciated this chart that shows the distribution of automations across them:
Perhaps not surprising that sales operations is the largest (44.6%) — more than twice the size of campaign operations (22%). Salestech is the new martech, and it’s on fire.
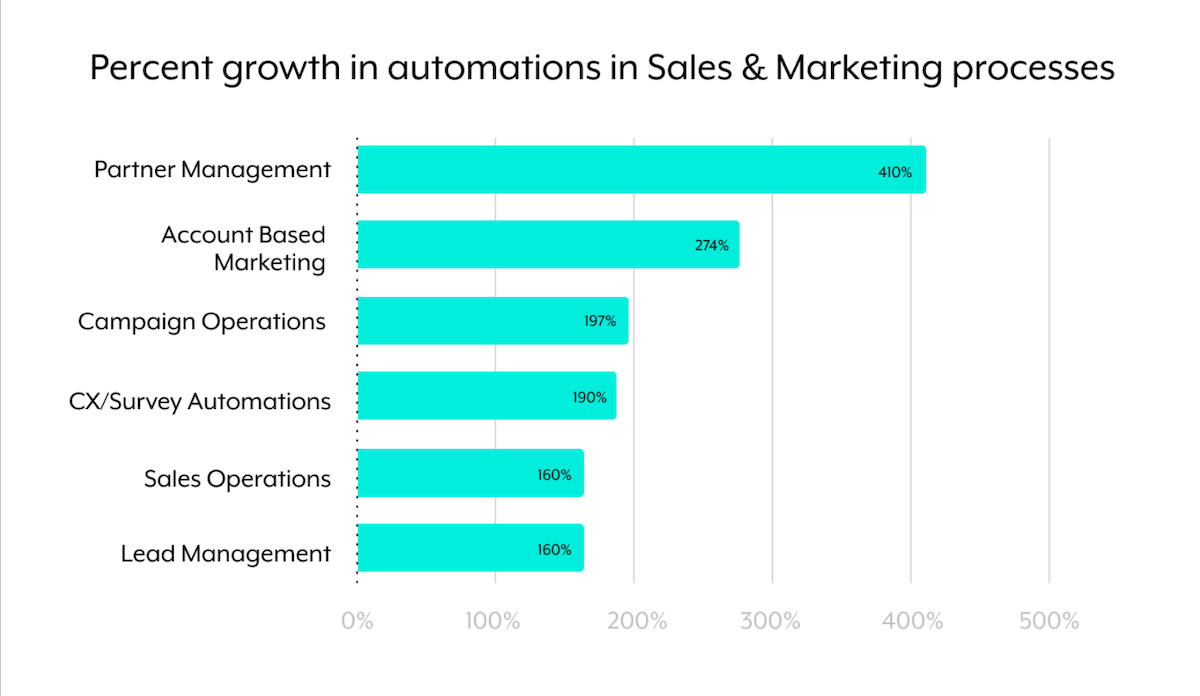
But it’s also fascinating to see which kinds of automations are seeing the greatest growth within marketing and sales too:
Automating partner management is the new kid on the block. Although only 2.3% of the pie, it’s grown 410%. Account-based marketing is also growing rapidly, up 274%.
Lots more great data in their report. I recommend downloading it.
