It’s a new year — a new decade — ahead. The 10’s will be a spectacular era for those of us at the intersection of marketing and technology. And before the next decade is out, there’s going to be a lot more of us in that nexus.
But here on the immediate horizon, there’s the business of New Year’s resolutions.
Of course, there are the obvious ones: better search engine optimization (SEO), better conversion rate optimization (CRO), better web analytics practices, and better social media integration into the fabric of the organization. And a better diet and more exercise.
However, here are three resolutions to consider that are less obvious yet equally important — ones that marketing technologists are well-suited to lead:
#1. Creatively visualize your marketing data.
It’s a deluge out there — we’re drowning in data, yet parched for perspicacity. Making sense of the terabytes of tracking and analytics data flooding into our domain is as hard as it’s ever been. And every year, we collect more, more, more.
One powerful — and underutilized — antidote to the cacophony is better data visualization. Sure, the software you have probably produces standardized bar charts, pie charts, and line graphs of standardized metrics. But in this age of digital discovery, the standardized answers aren’t necessarily the most useful.
Think of yourself as Christopher Columbus — or Christina Columbus — on a sea of data, dauntlessly seeking the new world of marketing insight. Creative visualization is your Santa Maria sailing ship.
There are two inputs into creative visualization:
- combining and comparing different pieces of data;
- experimenting with a wide range of graphs and drawings;
Creative visualization should be both playful and serious. For inspiration on different pieces of data, start with David Berkowitz’s 100 Ways to Measure Social Media.
For inspiration on a wide range of graphs and drawings, see Presentation Zen, The Back of the Napkin, the Google Chart API, and — of course — Edward Tufte.
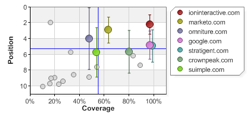
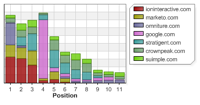
For example, here are a few visualizations I was recently doing for PPC competition on Google AdWords, to explore how different advertisers stake and evolve their strategies (I’ll do a follow-up post explaining this in more detail):
#2. Boost your marketing clockspeed by 2X.
Digital marketing is possibly the fastest moving industry today. Yet marketing management and execution, especially in larger organizations, is still quite slow. In the old days, before electricity — I mean, the web — it was okay to take weeks and months to plan and produce new campaigns and market-facing messages and experiences. But today, the operational tempo of marketing needs to be measured in days if not hours.
Unfortunately, there are a lot of legacy processes and politics that can gunk up high-speed marketing machinery. If you’re brave, bold, and diplomatically-gifted, make a resolution to significantly improve this in 2010 — even if you just tackle one or two important capabilities, such as your ability to produce targeted landing pages.
Pick a key digital marketing tactic — one that’s been feeling particularly sluggish to you this past year — and find a way to cut its end-to-end time in half. Or better.
Here are two suggestions to energize and accelerate your marketing operations:
1. Make a flowchart. Start at the beginning and jot down every step, hand-off, or approval that is required to execute a particular tactic. Draw arrows indicating the flow, noting any loops. Use your best judgment on granularity. At each step, approximate how much time it takes. Picture something like how a bill becomes a law in the US Congress — hopefully your situation isn’t that convoluted and political.
A ridiculously complex flow chart can be a burning platform. (No need to actually set it on fire, though.) Brainstorm with stakeholders on how to simplify it. What’s necessary? What’s ancillary? What’s a pain in the bottom? What would Google do? Where possible, eliminate costly detours — or relegate them to exception management. If a particular step seems to take a lot of time, examine it more closely: how can software or process changes optimize it?
2. Start adopting agile marketing practices. More things to do than hours in the day to do them, and all of them need to be done now? Sounds like the perfect justification for applying agile development practices. Agile isn’t just an adjective and an ideal — it’s an actual methodology. And there’s nothing like a daily scrum to squeeze out unnecessary delays and inefficiencies from their hiding spots.
To learn more about agile marketing, here’s a great article on the Marketbright Blog about the agile marketing method, Matt Blumberg’s visionary post on agile marketing at Return Path from 4 years ago, and Anna Maria Virzi’s example of agile post-click marketing.
#3. Link into the linked data movement.
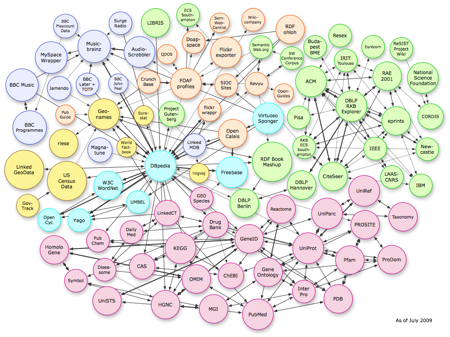
It’s time to join the emerging web of data, sometimes called the Giant Global Graph of linked data. Now that Best Buy has reported success with their product semantic web beta, the commercial benefits of sharing data, not just unstructured content, are starting to surface.
It’s just not that hard to get started, and join the linked data cloud above. Make the commitment to add RDFa markup to your web site — even if it’s only for a few select elements such as events or product specs. Check out standardized data vocabularies such as the Dublin Core and GoodRelations.
Experiment with DBpedia and Freebase to see how to interconnect with and leverage other data in your own applications.
This isn’t a mainstream issue yet, but like the web in 1994, there’s an opportunity for the pioneers and explorers of the next era of web marketing to stake their claims and lead the charge. Getting ahead of the curve on this in 2010 might prove to be one of the best competitive advantages you can acquire for the decade ahead.
Have a safe and happy New Year!


Great post! Tight list of three things that are all worth some added focus in 2010. For the data visualization piece, I’d throw in getting a copy of Information Dashboard Design by Stephen Few as well — there are a couple of parts of the book that are truly “dashboard”-specific, but most of the content applies much more broadly to data visualization overall. Unfortunately, Few’s site/blog aren’t that great/useful…but the book is outstanding — it’s an “applied Tufte” book in a lot of ways.