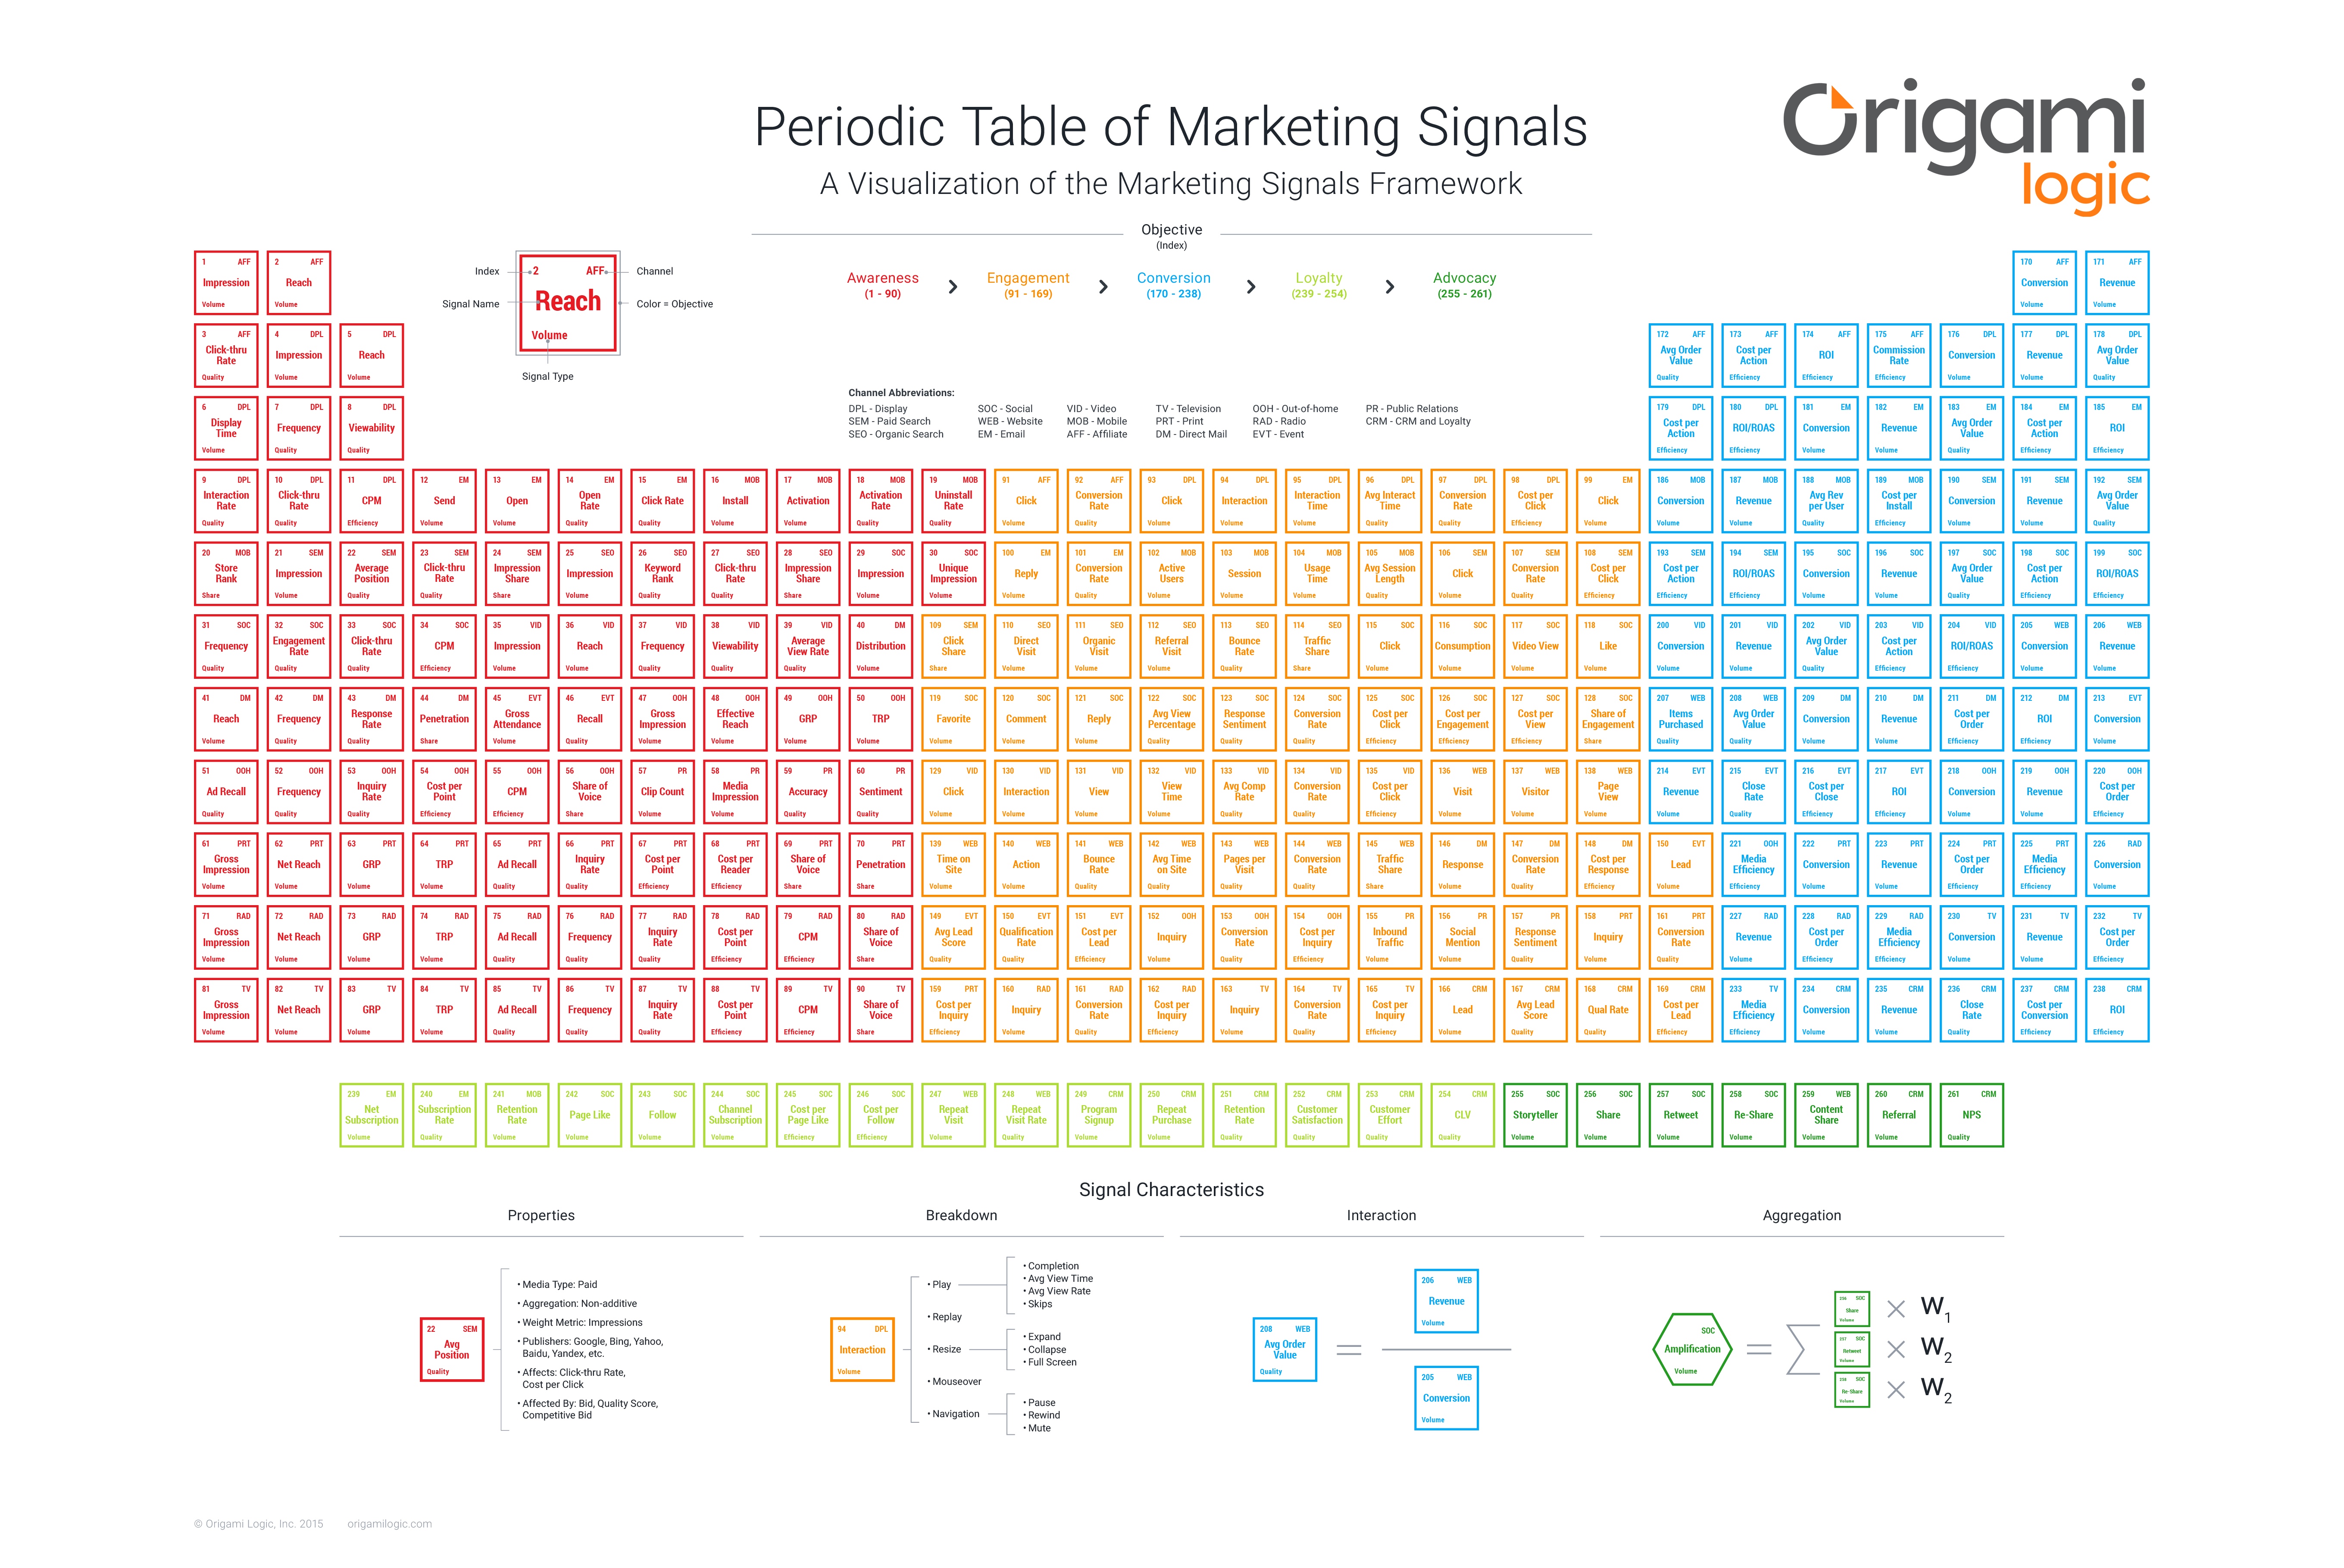
The following is a guest post by Steven Wastie, the CMO of Origami Logic. While it naturally aligns with his company’s solution, I think his Marketing Signals Framework — and this absolutely epic Periodic Table of Marketing Signals — transcends their own product and is a powerful concept for marketing technlogy management. CLICK ABOVE FOR A LARGER VERSION
As a modern marketer, you’re overwhelmed with information, all the time — and there’s no end in sight as complexity and the pace of change shows absolutely no sign of letting up.
Your job looks nothing like it did five years ago — even one year ago. Yet despite this permanent state of change, you are, more than ever, accountable for knowing exactly what’s happening across your organization’s eclectic mix of marketing activations at all times. So you’d have no problem explaining how your campaigns are performing right now, today. Right?
It’s a simple question, but for most, it’s incredibly difficult — if not impossible — to answer. Mastering measurement has always been hard and, for many, even aspirational. As measurement vectors and approaches become increasingly diverse and sophisticated, many marketers are more than a little overwhelmed.
Marketing Signals: Bridging a Critical Gap
As channels, platforms, media and devices proliferate and fragment, there are more ways for consumers and brands to interact than ever. This is causing an explosion in the number, types, and velocity of marketing interactions, making it difficult for marketers to understand which of them matter, which are relevant, and which warrant a response. With no respite in sight, what’s the solution?
It’s time to start thinking in signals.
Marketing signals make the critical connection between data and insights. They are responses to your marketing activity, such as ad clicks, social interactions, or website visits, along with derived performance indicators provided by marketing platforms such as click-through rate or cost-per-conversion. These signals provide the best picture of audience interest and intent, as well as marketing performance, across paid, earned and owned media.
Right about now, you’re probably thinking, “This sounds great, but how do I actually select the right signals?” A good question, as there are countless signals clamoring for marketers’ attention. Making things more difficult, there’s no such thing as a “top signal” for the masses, or a handy list of prioritized signals to follow. By definition, any signal can be important — each unique campaign dictates the significance of the signal.
To make the proliferation of marketing signals actually work for you, you must first decide on a disciplined way to select, collect, organize, integrate, and analyze them. Only then will you be able to measure and optimize campaigns in a strategic, standardized manner.
No More One-Size-Fits-All Approach
A new, company-agnostic Marketing Signals Framework provides marketers with a “method to the madness.”
By organizing key signals across all marketing channels, this framework helps marketers understand which signals are key to their specific campaigns’ success. Selecting signals according to campaign objectives instead of predefined sets of metrics enables marketers to better align their marketing measurement towards their goals, and generate insights more efficiently (click for a larger version):
The Science of Signals
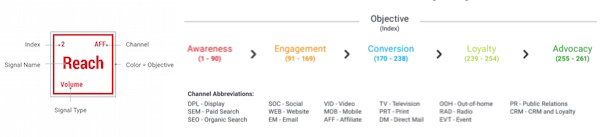
The Periodic Table of Marketing Signals is a visual representation of the Marketing Signals Framework and organizes signals across marketing channels according to three specific dimensions:
- Channel: The single channel where the marketing activity is executed. It can be digital (e.g., display, paid search, social) or offline (e.g., print, TV, radio).
- Objective: The specific business objective of the campaign or activity. Signals are categorized by the following objectives: awareness, engagement, conversion, loyalty, and advocacy.
- Signal Type: The approach used to quantify campaign success. Signals are organized by volume, quality, efficiency and shares.
Using this framework, marketers can easily identify the signals that matter based on the campaign objective or marketing activity, channels used for activation, and the approach used to quantify success.
Now let’s see it in action.
Imagine your company is launching a product in a new market, with a cross-channel campaign activating across TV, display, and social channels. As this is an initial entrance focused on growth, you do not expect to show ROI immediately. The primary objective is to garner as much awareness as possible, with media efficiency also being an important factor — as you have limited budget per usual. Additionally, you are interested in measuring website engagement volume to assess the increase in brand awareness.
Using the periodic table, you can browse through the red “Awareness” block, to search for volume and efficiency signals in the relevant channels: TV, DPL, and SOC.
Based on this exercise, you end up with the following set of signals to measure:
- TV: Gross Impressions, Net Reach, GRP, TRP, Cost per Point, CPM
- Display: Impressions, Reach, Display Time, CPM
- Social: Impressions, Unique Impressions, CPM
Next, to find Engagement signals, you move to the “Engagement” block, colored in orange, and locate the relevant WEB volume signals:
- Web: Visits, Visitors, Page Views, Time on Site, Actions
The periodic table represents just one portion of the entire marketing signals framework. Layers above include compound signals, such as cross-channel impressions, or total social engagement across all engagement types. These compound signals help to simplify measurement by reducing the total number of signals and can be customized based on campaign and context.
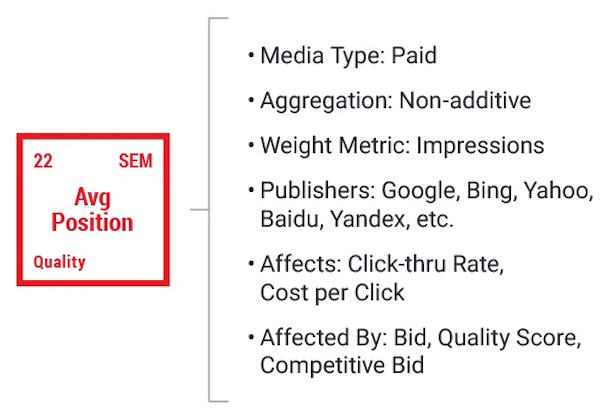
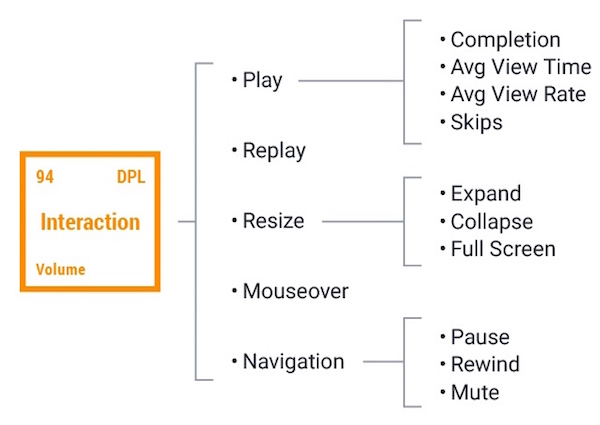
Each marketing signal has a number of characteristics that describe how they behave, where they are applied, how they break down, how they interact with and affect one another, and how they combine to form compound signals. These characteristics are key to understanding how each signal should be analyzed and interpreted.
Here are some examples:
- Signal Properties: Understanding detailed signal properties is important for a number of reasons. Some signals are only available for a subset of media or publishers or may represent slightly different types of response depending on the media or platform source.
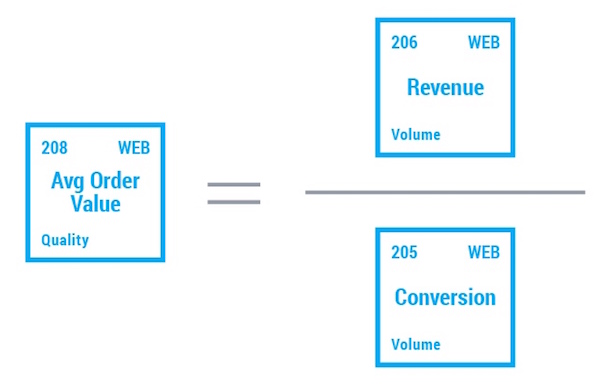
- Signal Interaction: Signals affect one another and some can be derived as a calculation of other signals. Understanding how signals interact helps greatly in analyzing marketing results and identifying the root cause of performance changes.
- Signal Breakdown: Certain signals are themselves aggregates of smaller sub-signals. As the marketing landscape shifts and measurement standards change, sub-signals can gain greater adoption to become independent signals in their own right.
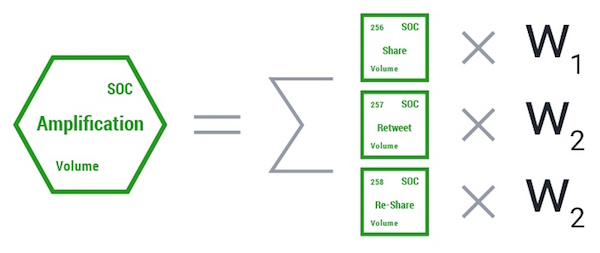
- Signal Aggregation: Compound signals are formed by aggregating multiple signals within or across channels. They help simplify measurement by reducing the total number of signals required, but should be used with caution as they can be misleading given the wrong context.
Indicators, Reimagined
It’s important to note that marketing signals are not new indicators. Rather, they include and build upon existing measures of performance.
Take ROI, for example. In many cases, ROI is an important metric to use in evaluating the success of a campaign. However, it does not paint a complete picture, as underlying data is often inaccurate, incomplete, or out-of-date. Additionally, ROI metrics may not be in context of individual needs and campaign objectives.
Marketing signals — unlike traditional metrics or data — include multi-dimensional measures of quality and relevance to ensure they generate the best and most valuable insights. Additionally, calculations of KPIs specific to campaign objectives and categorization of performance by brand, country, product, etc., add context to the data and make results more relevant to the business. Finally, marketing signals blend science (numbers and metrics) with art (creative, copy, metadata, and strategy) to comprehensively illustrate what is working.
Simply put, marketing signals go beyond representing results. They reach further, bridging the gap between raw data and insights, allowing marketers to gain immediate and clear direction on where opportunities lie and how to further improve results.
More than the Score
Just as traditional indicators are still very relevant, so too are campaigns. Despite catchy headlines trumpeting the “death of the campaign,” campaigns will never cease to exist, as consistent messaging, over time and across channels, has a greater impact on brand awareness than “random acts of marketing” ever will.
However, in the new world of marketing signal measurement, campaigns must be continuously measured, adjusted, and optimized mid-flight. What happened last week or last month is increasingly insufficient as consumers demand immediacy and relevance. Signals provide marketers with new opportunities to engage consumers in the moment — when they are most receptive.
The marketing discipline continues to evolve and has become a complex, rapidly changing, and noisy daily battle. Cutting through this noise and measuring the signals that matter has become a strategic priority — not just for marketing, but for the business.
It’s not just about keeping score or vanity metrics anymore. It’s about finding new ways to win. Using a standardized framework to organize and analyze signals provides a way to not only understand what your score is right now, but also to distinguish “real” goals from “vanity” goals, find ways to score goals faster and better, and make sure that the goals you are scoring are relevant and understood by the business.
Thanks, Steven!
Looking for more insight on marketing technology management? Be sure to check out our upcoming MarTech Europe conference in London, November 1-2. You can use the code “MarTechInsider” (case sensitive, without the quotes) to receive an extra 10% discount.
Get chiefmartec in your inbox
Join 42,000+ marketers and martech professionals who get my latest insights and analysis.