This article is a guest post by Jordan Con of Bizible. It was entered into The Hackies essay contest for the upcoming MarTech conference. Like it? You can register your vote in the contest by sharing it on social media, especially LinkedIn, Facebook, and Twitter.
Whenever we look back at our best performing content, a clear trend appears: content where we share our data consistently performs well.
In general, we’ve found that the most effective marketing is when we can create win-win situations — we provide value to our target audience, and in return, they give us a little more trust. This can take the form of a form fill, a demo request, a referral, a returned email, or a number of other actions. When we’ve built up enough trust, prospects have confidence in us and believe that our product will benefit them as promised, and become customers.
On our part of this value exchange, there are several avenues in which we can provide value. We can provide inspiration and demonstrate knowledge with thought leadership pieces. We can teach prospects how to get better at their jobs with educational content. We can provide valuable data and research by sharing our unique dataset.
For many companies, especially those in the martech space, a key product differentiator is a unique approach or a unique perspective on data. Therefore, you should be able to offer unique data and a unique viewpoint to your target audience.
(NOTE: Above all, be good to your customers. Take all necessary steps to do so, such as removing or anonymizing and aggregating sensitive data.)
But by sharing your unique data, not only are you acting as a valuable resource for research, you’re demonstrating your capabilities. For us, because we are a marketing measurement and reporting solution, the line connecting the research that we publish and what we do is pretty clear. But for marketers in different industries, sharing your unique perspective still shows the value of your product and your expertise in that space.
Leveraging this data is the key to creating super effective marketing content.
Let’s take a look at some examples:
AdWords Benchmark Report
One of our top performing pieces of content is the annual AdWords Benchmark Report. Now there are several benchmark reports about search marketing — what makes this one so special? Most AdWords benchmark reports focus solely on top-of-the-funnel channel metrics: impressions, clicks, and conversions. This is where we use our unique dataset and our unique perspective as a differentiator.
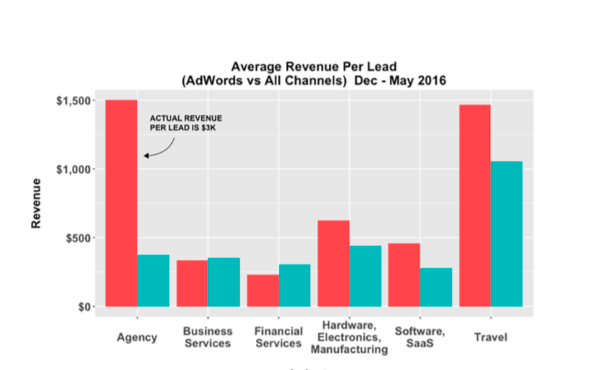
It’s helpful to know how your click-through rate and conversion rate compares to other companies like yours. But it’s way more valuable to be able to compare the down-funnel performance of your AdWords ads. Are you driving leads, opportunities, and revenue as efficiently as your peers? Is your AdWords revenue per lead as good as your industry benchmark? These are the critical questions that paid media managers want to know.
Because we have this data from hundreds of customers, we can provide this valuable data. (Aggregated and anonymized, of course — Bizible value #1: customers first.)
Essentially, while other benchmark reports answer, “Are you driving clicks as well as your peers?” our report answers, “Are you driving sales opportunities, pipeline, and revenue as well as your peers?”
This dataset is really valuable and has proven that it has earned a lot of trust from prospects and customers. Since we published it, it’s driven the third most pipeline out of any downloadable piece of content that we offer. Additionally, our LinkedIn Benchmark Report (a similar report, but for LinkedIn Ads) comes in at number two in terms of pipeline generated since it was published.
Other Examples
Simply Measured, a social measurement and analytics company, offers really rich data about social media performance. Because they excel at measuring how far a brand’s voice spreads over social media — organic, paid, influencers, etc. — they’re able to share powerful data and insights. A number of their blog posts take a look at a significant happening with a brand, and then analyze the social metrics behind it.
Inbound marketing experts, Moz, frequently share data that they get from Moz’s tools as blog posts, videos, and even social posts. They run experiments on themselves, see how they affect keyword ranking, page traffic, etc. and then share the results. Some of the experiments are big and get shared in blog posts or ebooks, but they can also be small experiments that warrant just an interesting tweet with a screenshot.
Right in the heart of the 2016 holiday season, AdRoll wrote a post, coupled with a webinar and infographic, about why marketers should continue to run holiday ad campaigns in January. Since on the surface it’s a contrarian piece of advice, AdRoll backed it up with AdRoll data, which makes the piece much more valuable and convincing compared to if they had just made a theoretical argument.
When marketers share their unique data, they create valuable content that builds trust with prospects. For us, it’s been the source for some of our most valuable marketing, driving significant pipeline and revenue.
What did you think of this article as an entry in The Hackies essay contest for the upcoming MarTech conference? If you liked it, you can register your vote in the contest by sharing it on sharing it on social media, especially LinkedIn, Facebook, and Twitter.
Have a marketing/technology/management “hack” that you want to share with the world? Consider entering The Hackies yourself — we’d love to learn from your experience and insight!


