UPDATE: The 2020 Marketing Technology Landscape is now available.
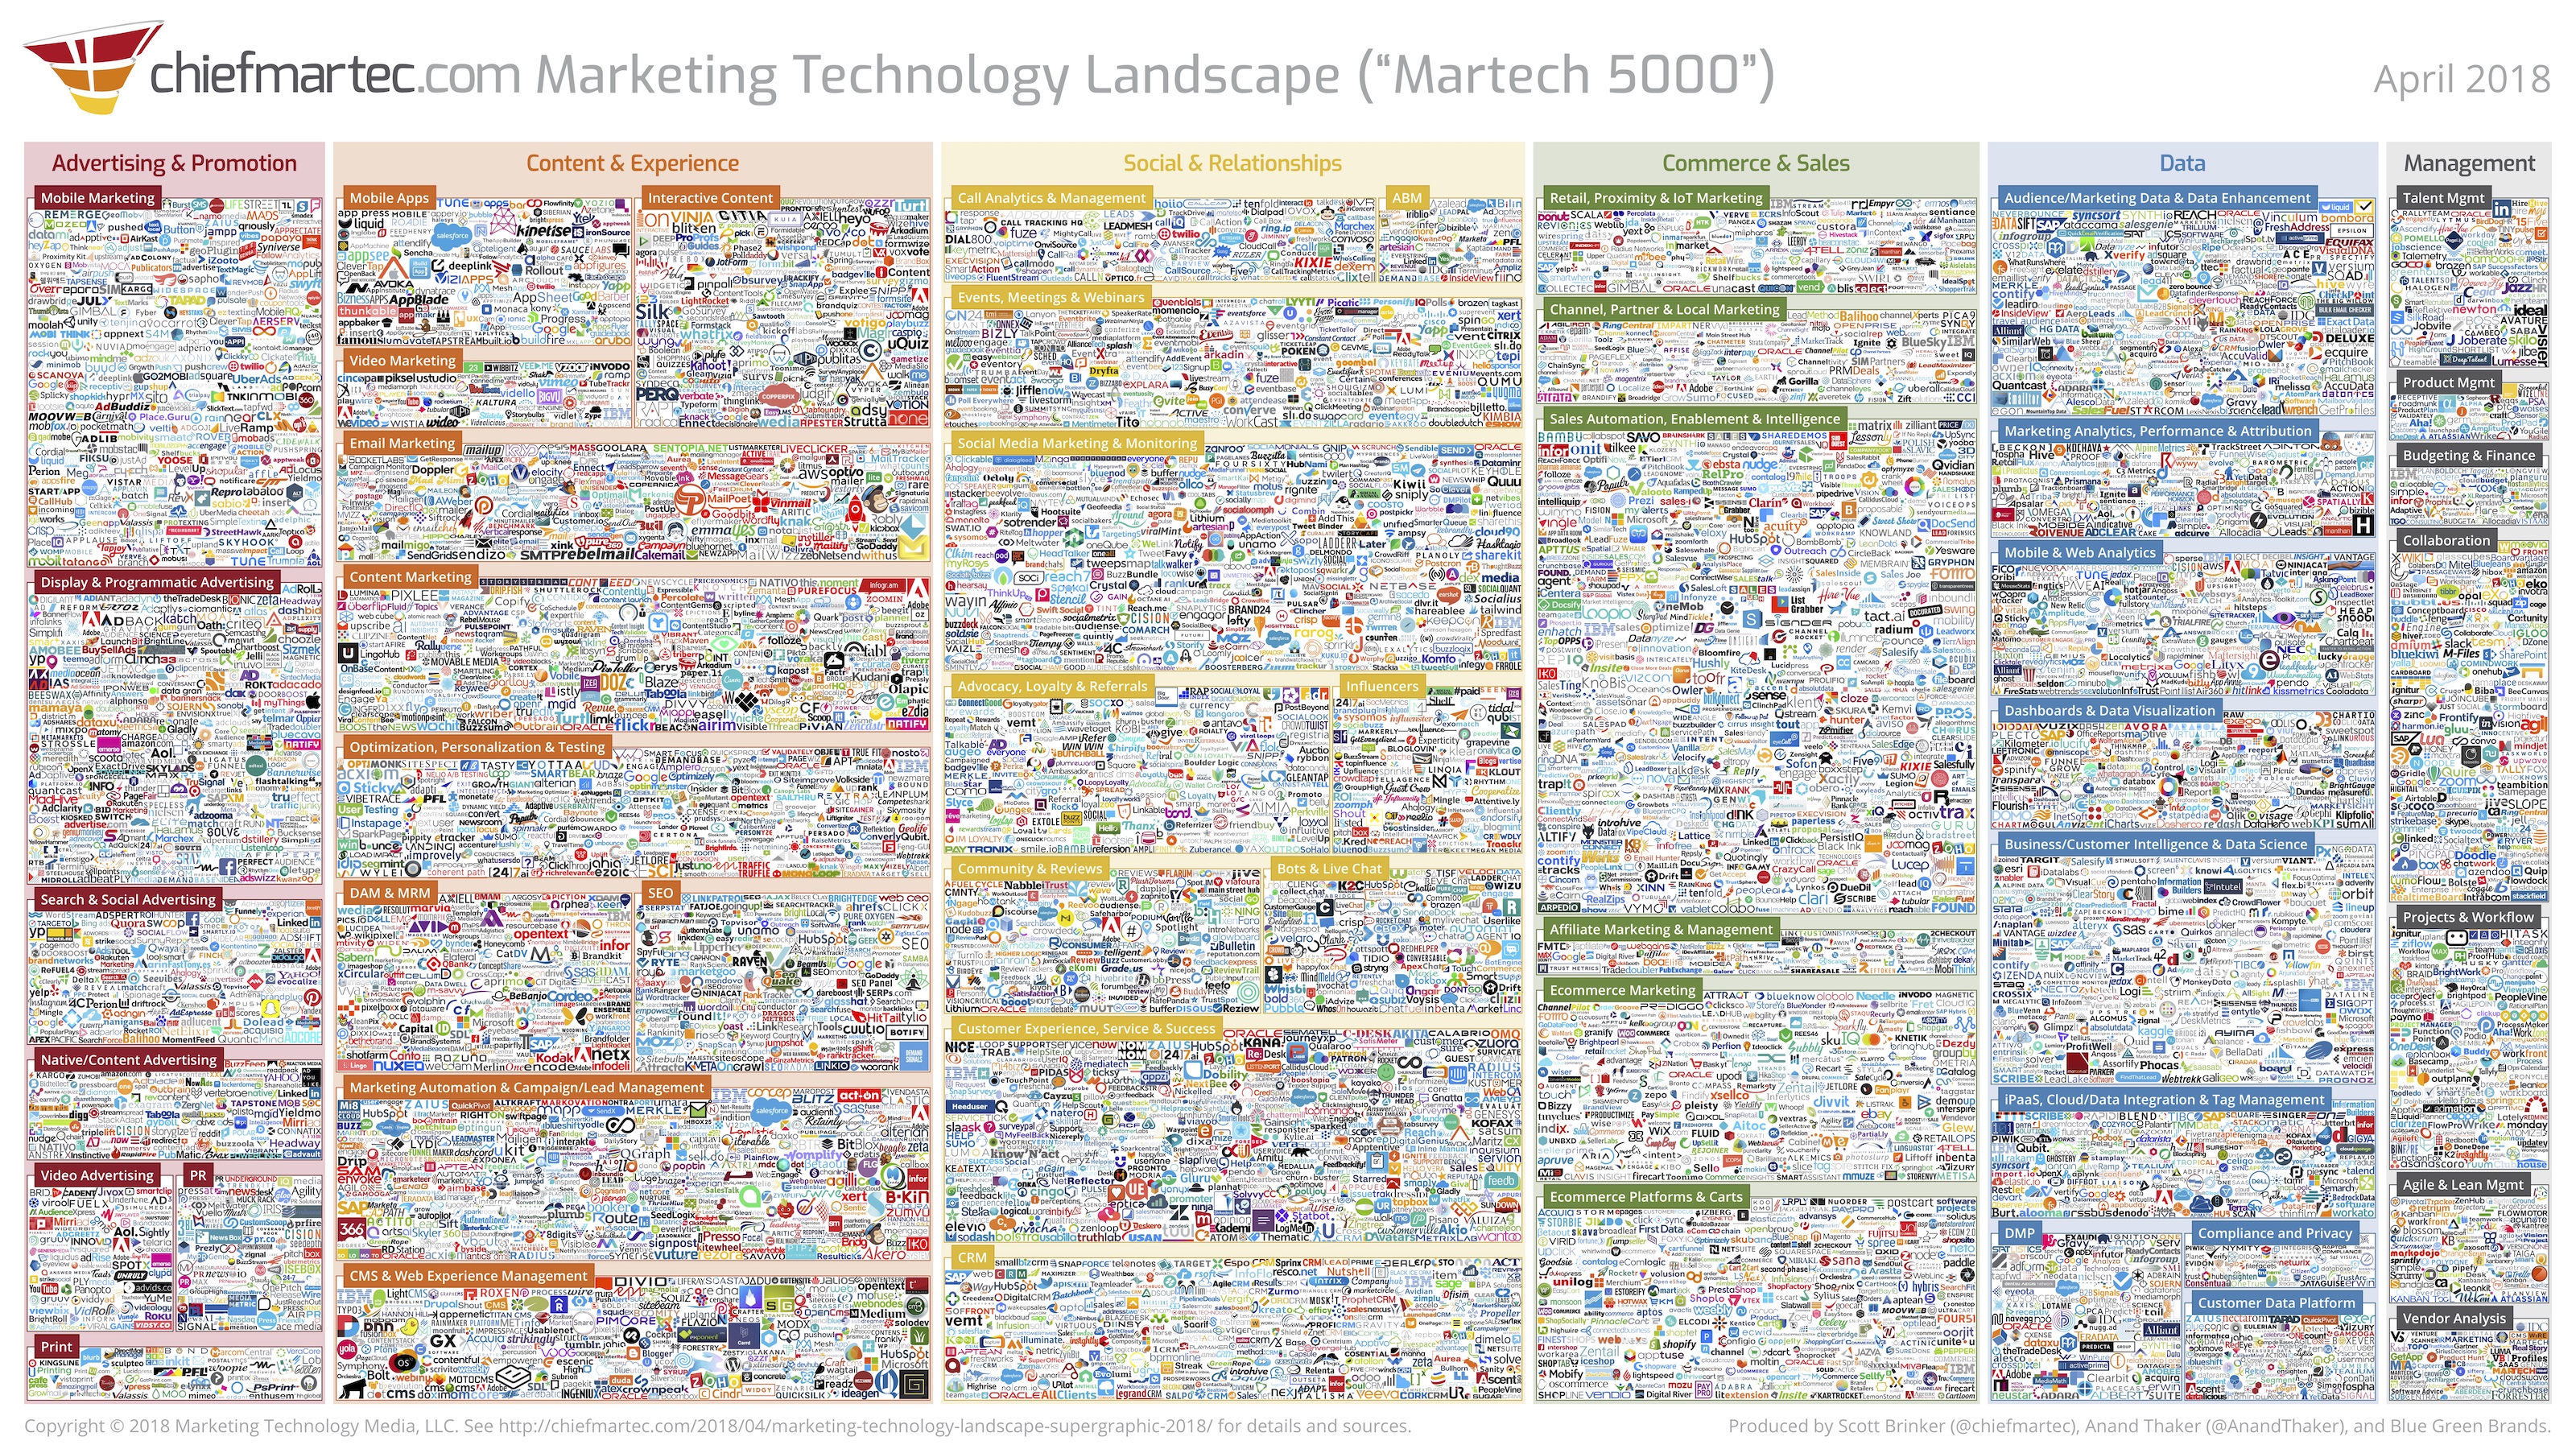
Like the running of the bulls in Pamplona — an apt simile? — it’s become a yearly tradition for me to release the marketing technology landscape at the MarTech conference in the spring. So here at our event in San Jose today, I’m pleased to unveil the 2018 edition of one of the most loved-and-hated slides in marketing:
Marketing Technology Landscape Supergraphic (2018) — 4.6MB Slide
(higher resolution graphics and an Excel file are available below)
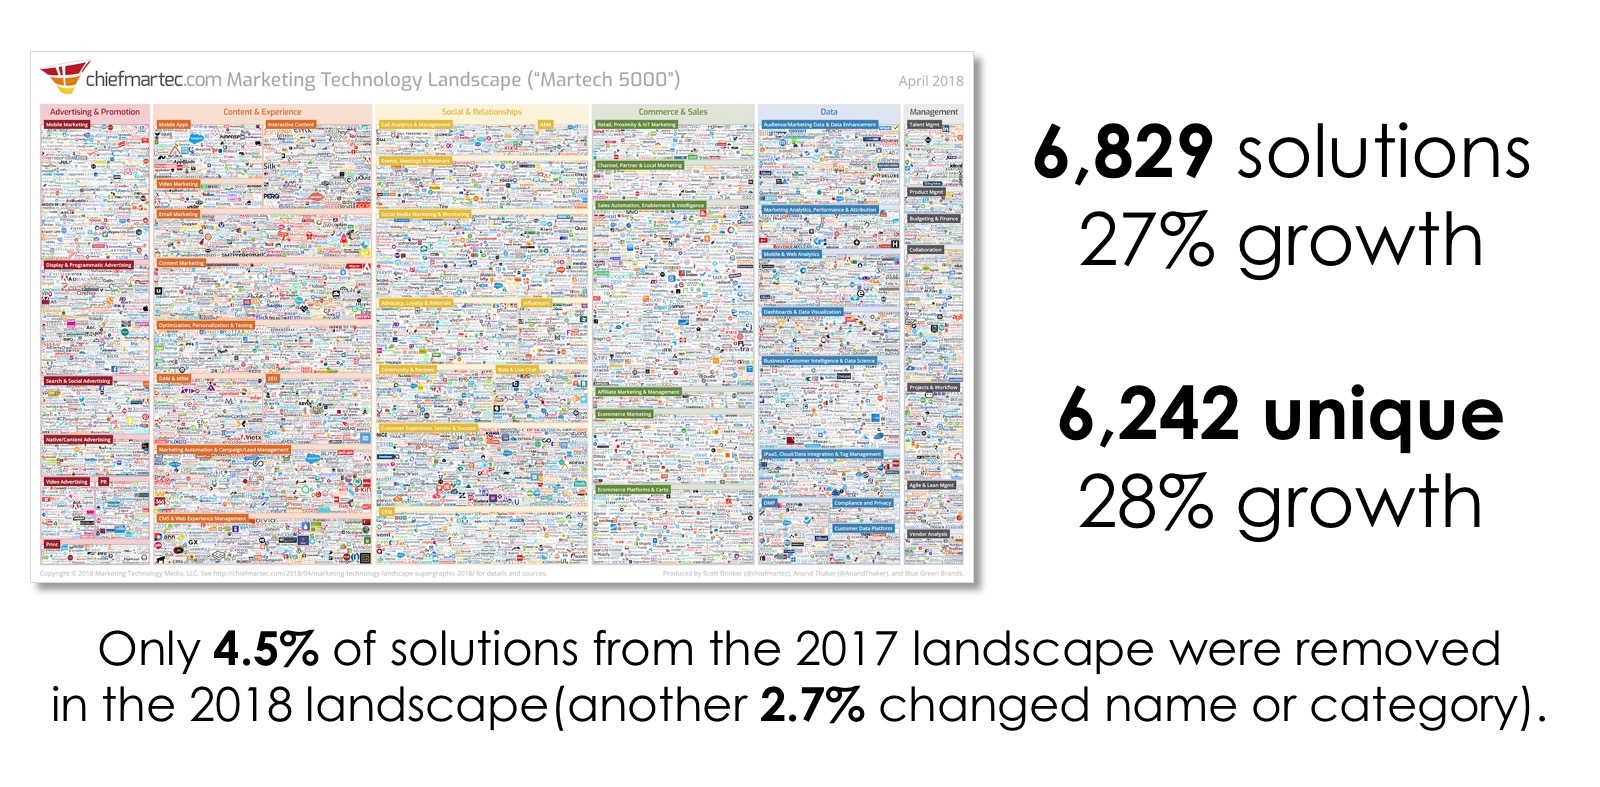
I’ve kept the nickname of the Martech 5000 — it has a certain ring to it — but this year’s graphic actually charts 6,829 marketing technology solutions from 6,242 unique marketing technology vendors.
While that represents “only” 27% growth over last year’s landscape, which mapped a grand total of 5,381 solutions, the percentage of growth belies the absolute scale of this space.
To appreciate the magnitude of martech’s diversity (and the effort behind this project), the size of the 2018 landscape is equivalent to all of the marketing tech landscapes we assembled from 2011 through 2016 added together:
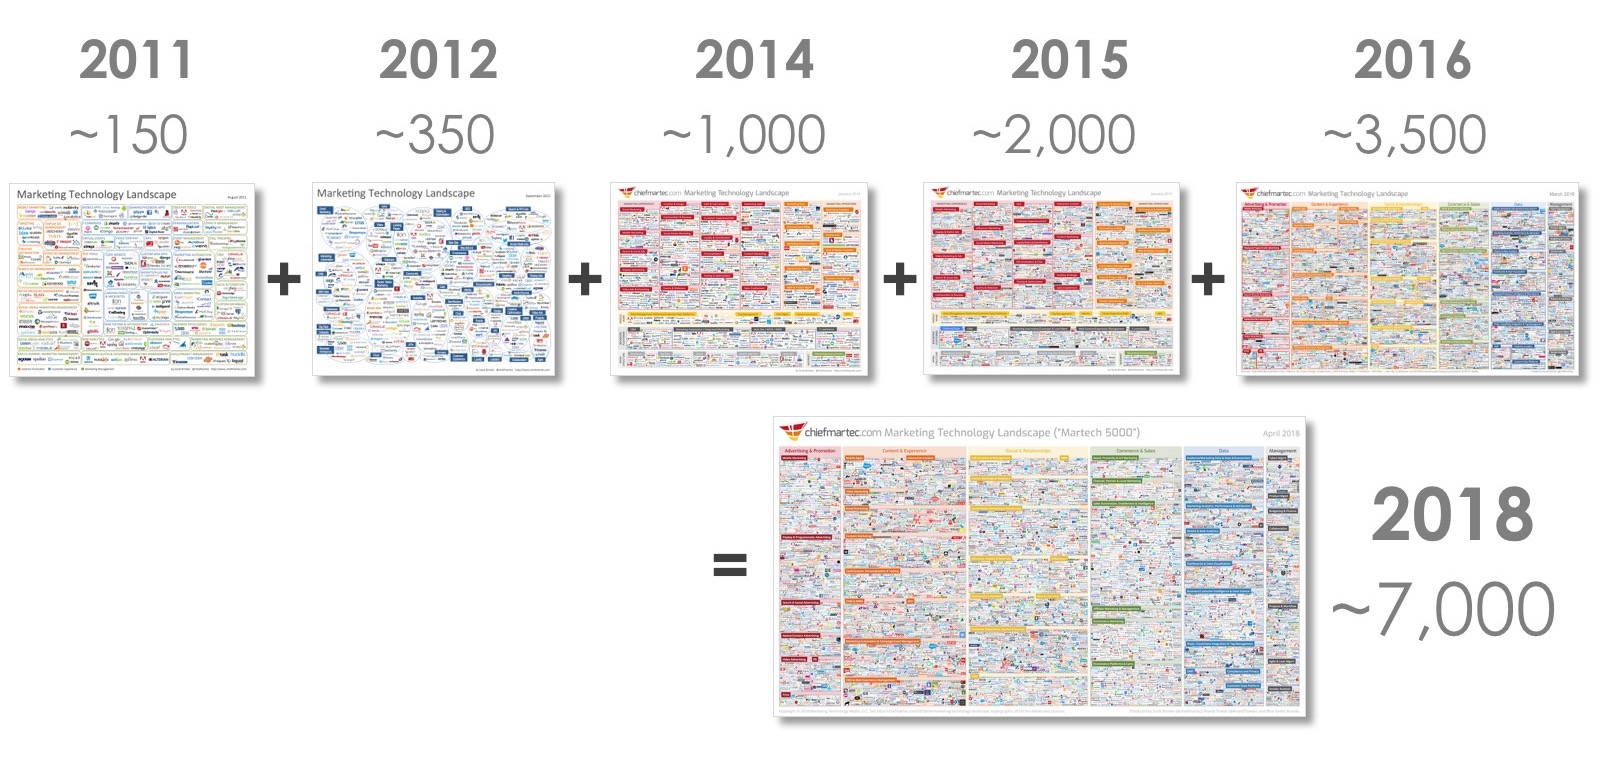
For reference, here are the 2011, 2012, 2014, 2015, 2016, and 2017 versions of the landscape.
Some important notes, and then I’ll share with you how to get a free Excel spreadsheet of all the solutions on the landscape and a super high-resolution version of the graphic suitable for zooming and printing:
- My collaborator from last year, Anand Thaker, fully led the data research for this year’s landscape through his company IntelliPhi. Once we had all the data and logos harvested, however, we turned over the visualization of the landscape to Jeff Eckman and his team at Blue Green Brands. I am immensely grateful for the magnificent work they all did.
- I expressly grant permission to reproduce copies of this graphic in full and “as is” in any slide presentation or website, up to a resolution of 3,200×1,800 pixels. (Or embed the graphic from my CDN). For higher resolutions or uses, please ask first. A backlink to this post would be greatly appreciated.
- This graphic is only our personal approximation of the marketing technology space and is surely rife with errors and omissions (our apologies). It is intended only to stir discussion. You can publicly identify or clarify your company in the comments section below and fill out this form to be added to our research spreadsheet for the next edition.
- Key resources used in our research to build this graphic: CabinetM, Capterra, G2 Crowd, Google, LUMA Partners, Siftery, and TrustRadius. We used these services to discover new companies and to triangulate our categorization. As always, a debt of inspiration is owed to Terry Kawaja, the godfather of vendor LUMAscapes.
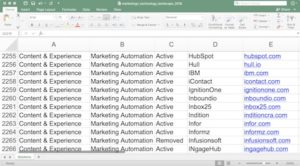
Take our martech data, please (and a high resolution graphic)
If you would like to download an Excel file of all of the solutions on the landscape and/or a high-resolution version of the graphic that you can zoom into print — up to wall-sized, if you’d like — I would simply ask you to subscribe to my blog (I won’t share your email with anyone else):
[click here and fill out this very short form]
Fill out the form linked above, and we’ll email you links to both the Excel file and a high-resolution graphic suitable for printing (be sure to save that email).
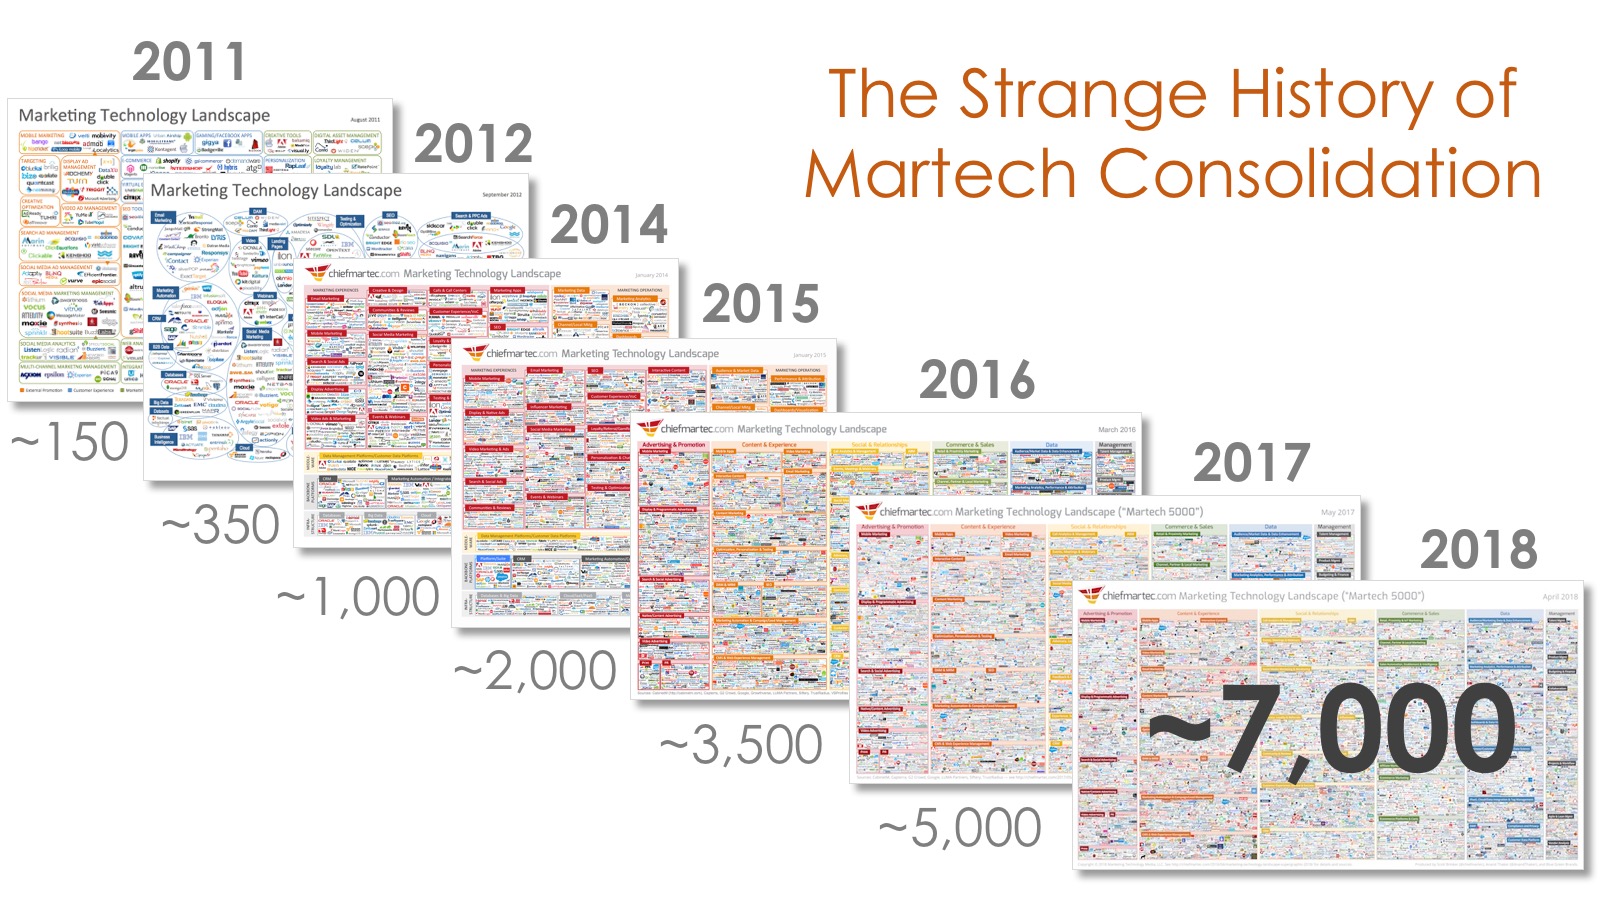
Martech consolidation fails to materialize… again
Four years ago, when I released the 2014 martech landscape, I wrote an article that asked: what if 1,000+ marketing technology were the new normal? It was shocking at the time, but now it seems kind of quaint.
Today’s martech landscape would need to consolidate by 85% just to get down to 1,000. Think about that for a moment.
Admittedly, this marketing technology landscape doesn’t accurately reflect the sizes of these different martech companies. If we were to organize them by valuation, the resulting graph would illustrate a classic long tail: a handful of multi-billion dollar giants in the “head,” quickly tapering out across a very long “tail” of thousands of smaller firms.

We see this long tail in the products that marketers adopt in their marketing stacks too. An analysis of all the entries to The Stackies from 2015 through 2018 by the folks at Boardview.io shows that the head contains the most popular vendors in CRM, marketing automation, social media, and CMS categories – and then extends into a very, very long tail of more specialized products that are highly diverse from one stack to another:
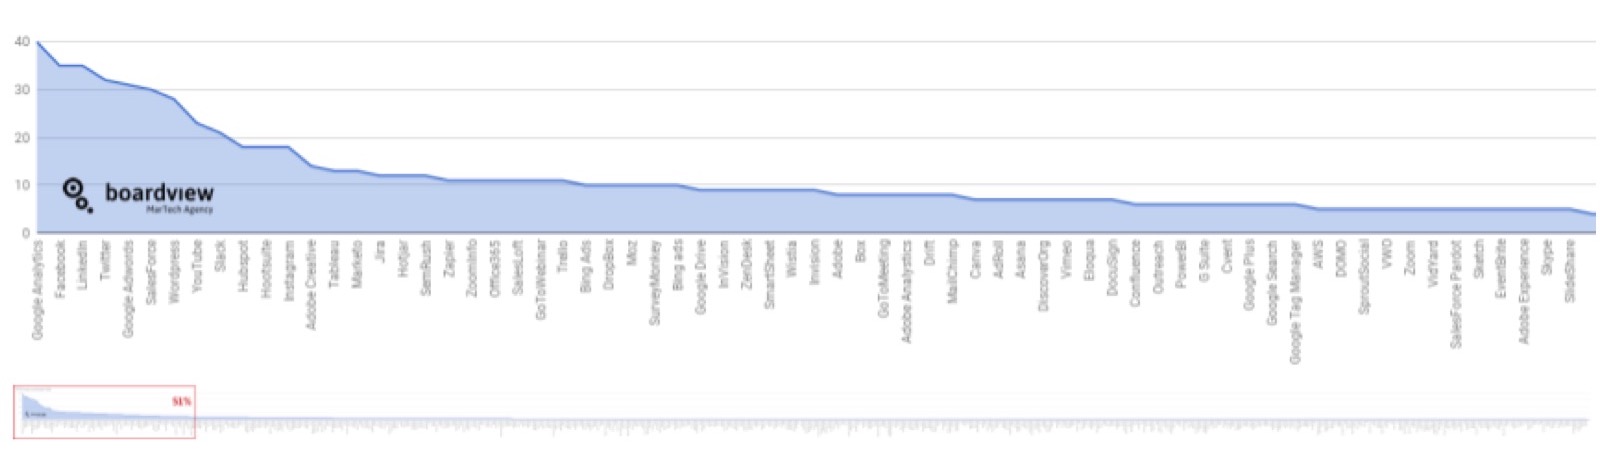
You really need to click on the graphic above to appreciate the full length of that long tail (the tiny line underneath the zoomed-in section of the first 51% of the products near the head).
That’s not to say that consolidation isn’t happening. Indeed, acquisitions continue to be made across martech and companies do go out of business. But from 2017 to 2018, only 4.5% of the solutions from the previous year “churned” — were acquired or exited the market in some less graceful fashion. Another 2.7% changed their name or pivoted to a different category.
It’s just that new companies still enter or grow in the market — either organically or venture-funded — at a rate that continues to outpace the rate of consolidation.
Water continues to flow into the martech tub faster than it’s draining out.
In fact, venture capital and private equity investment in companies across the marketing tech landscape has remained high over the past several years. Indeed, 2017 was a record year with over $14 billion invested in the sector.

Like the pig in the python, that investment is going to take some time to be digested among the current crop of marketing technology vendors. I expect we’ll see some very exciting activity in martech through 2019, even if new companies completely stopped entering the space.
Yet such a “martech freeze” of new entrants is unlikely.
While it’s conceivable that we may witness a massive “crunch” of martech vendors over the next 12 months, it’s also possible that the space will remain at its current size or — gasp! — continue to grow even more.
“How is that possible?!?” you might be asking incredulously.
I’ve written about this dozens of times over the years. My article from three years ago on the system dynamics of 2,000+ marketing technology vendors still holds true and explains the many forces at work in this environment in the most detail. But the short answer is:
- On the supply side, there are effectively zero barriers to entry in software today, thanks to tons of incredible open source projects, cheap infrastructure-as-a-service (IaaS), global on-demand talent markets, and low-cost channels for digital marketing.
- On the demand side, marketing continues to expand in scope and scale, wrestle with ever-advancing buyer expectations, assimilate new marketing innovations, face new market disruptions, and strive to differentiate themselves from a global multitude of competitors.
As much amazing marketing software as there is today, there is still opportunity for new ideas. Marketing should be — and can be — better.
One way that Anand describes this is the increasing resolution we seek in understanding and serving our customers as marketing technology continues to improve. Back in the days of the 2011 martech landscape, our digital representation of the customer was as sophisticated as a stick figure.
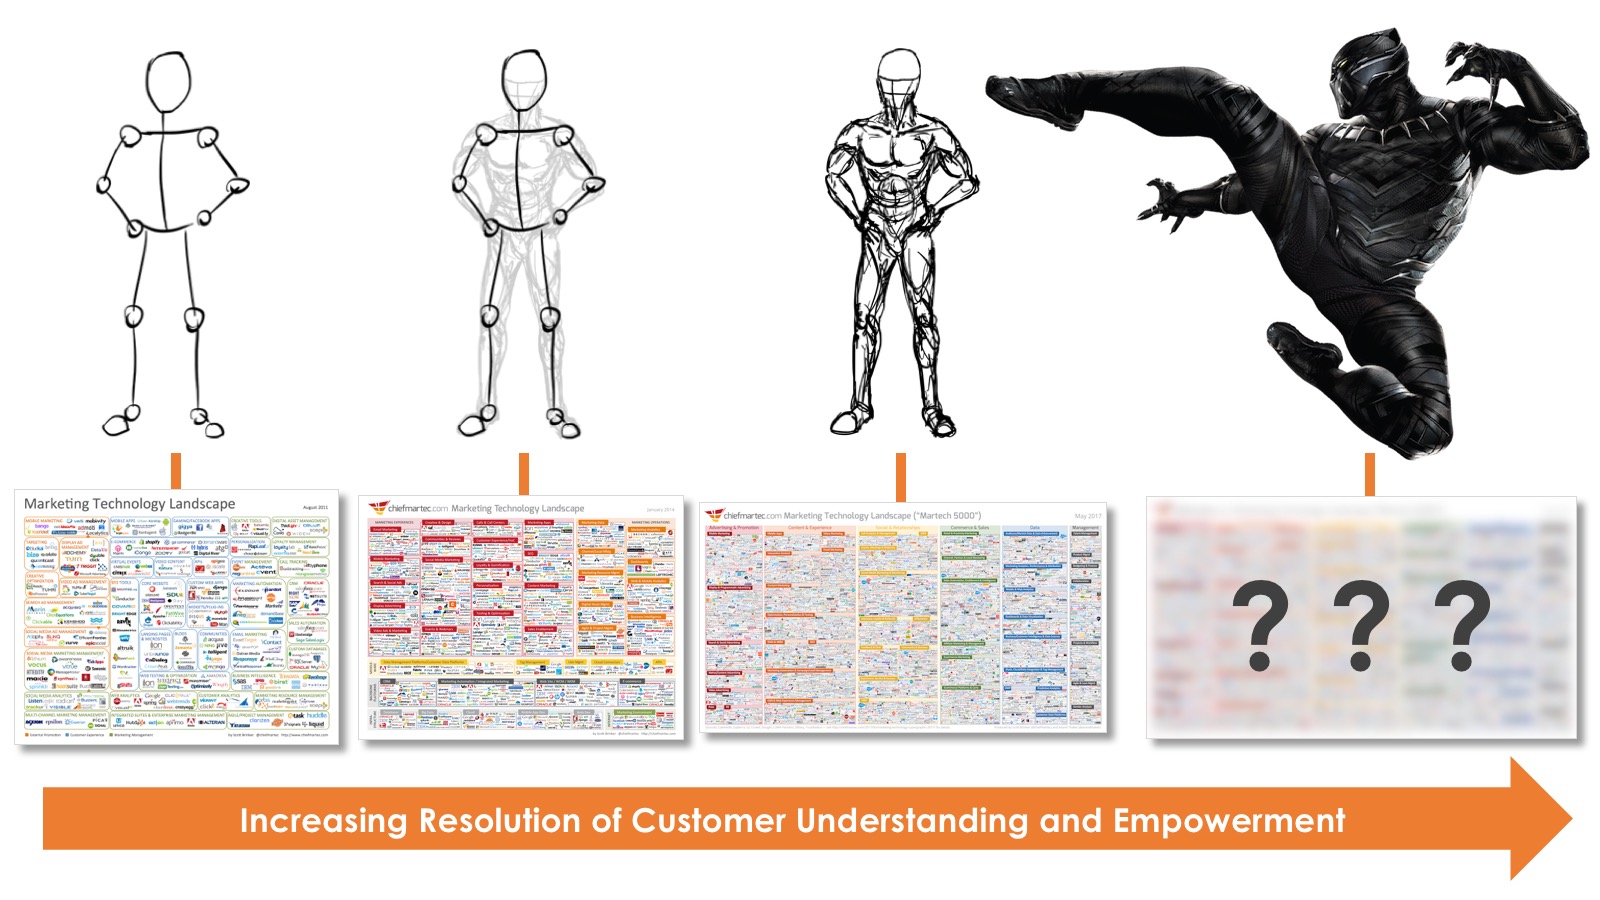
But as marketing technology has advanced — and as ever more specialized capabilities have emerged — we’re putting more flesh on our digital customers and striving to serve them in more human ways.
We still have a ways to go, but we aim to understand and empower customers as fully-fleshed out superheroes. As we pursue that goal, the marketing technology landscape must continue to evolve.
Changes in the 2018 marketing technology landscape
Aside from its growth, what else changed with the 2018 marketing technology landscape?

Well, for one thing, we got rid of the category for Predictive Analytics.
It’s not that predictive analytics capabilities have vanished. On the contrary, due to the huge explosion of machine learning in marketing, predictive features have been added to hundreds of products.
In deciding not to have an Artificial Intelligence category — because AI is embedded in so many products across all martech categories — we realized that predictive analytics solutions would be better classified in the category of the capability they enabled (e.g., web analytics or sales intelligence).
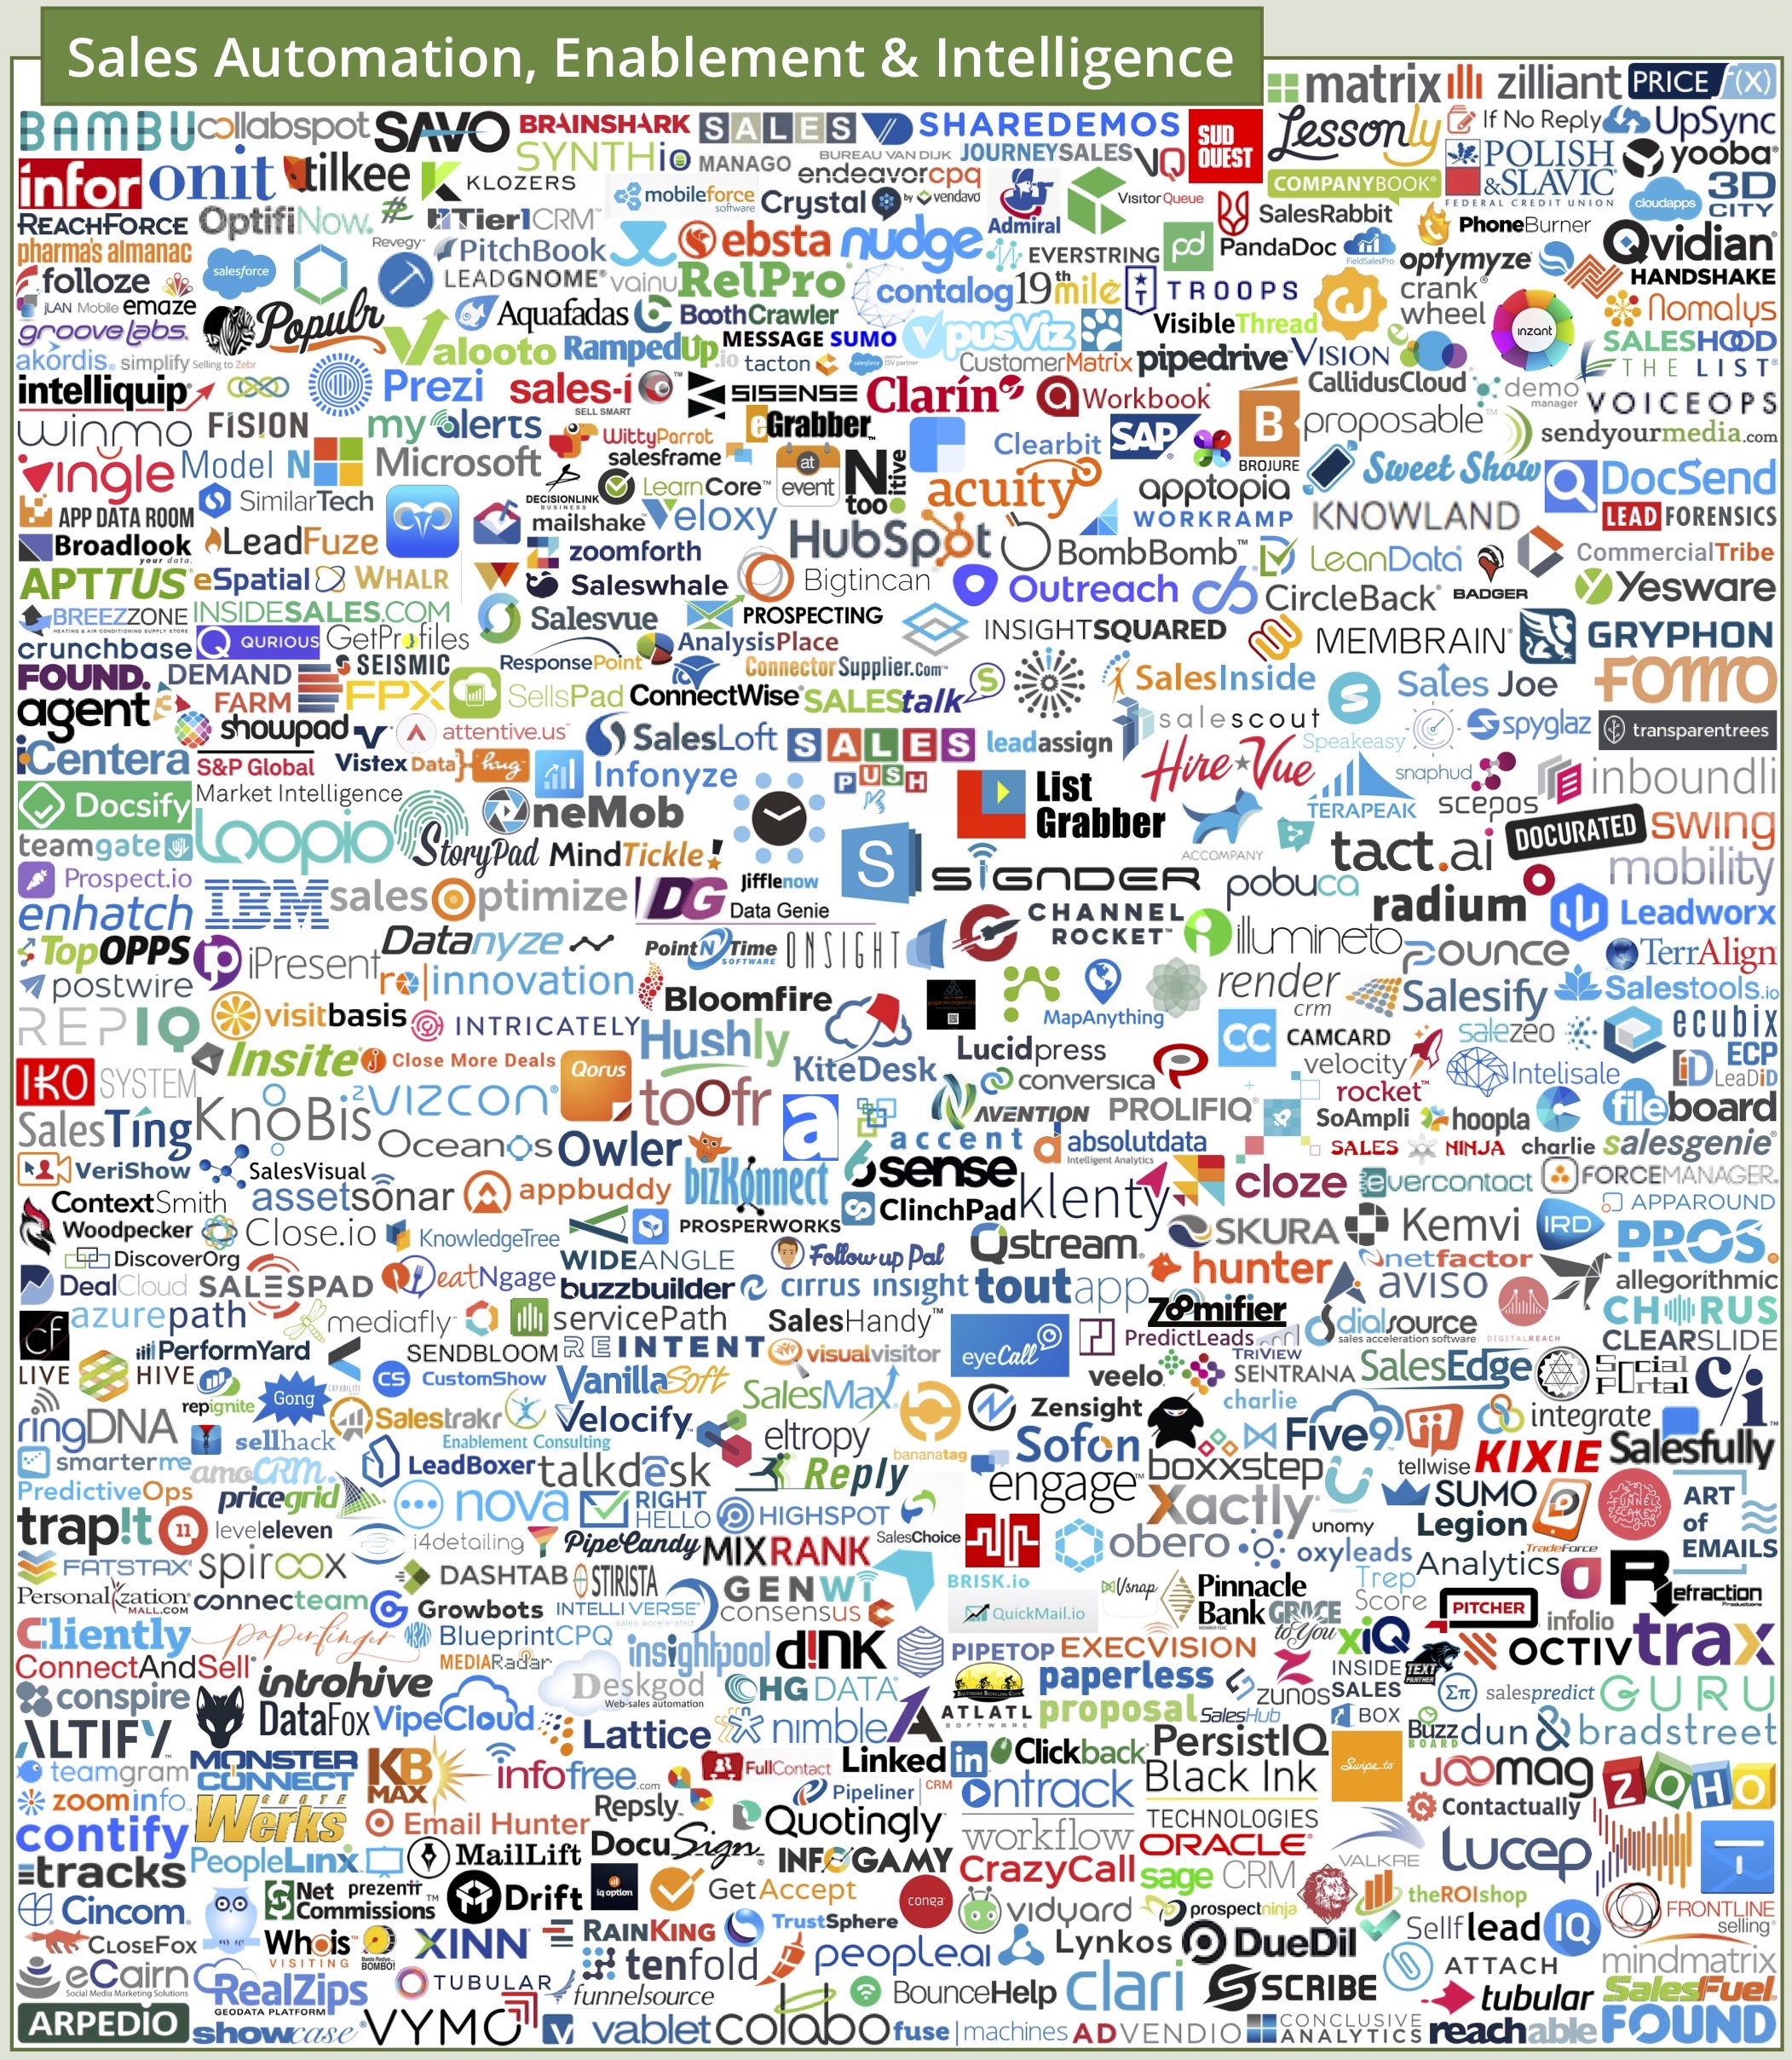
The largest category — i.e., the category with the greatest number of vendors — this year was Sales Automation, Enablement & Intelligence with 490 solutions.
“Salestech” is on fire!
So why keep the salestech category on the martech landscape? Because marketing and sales are deeply entwined — and only becoming more so.
It’s the same reason why Customer Experience, Service & Success are on the martech landscape too.
Together, marketing, sales and service are “the new marketing.” We could label the union of them go-to-market technology, customer experience technology, or digital transformation technology. All of those aptly describe the new reality of marketing.
But given how entangled these solutions are with all the other “proper” marketing technology categories on the landscape, how about we just call it martech?
The rise of Bots & Live Chat over the past year clearly warranted its own category in 2018.
Both text-based and voice-based chatbots have had an incredible year of innovation and adoption — and I’m confident that’s just a prelude to a spectacular 12-24 months ahead.
Aside from driving their own innovation, these new interfaces and customer touchpoints are accelerating the embrace digital everything too.
“Digital” is not just adtech and websites. And with so many different kinds of digital customer touchpoints, there’s incredible opportunity — both technologically and organizationally — to evolve from fragmented silos to a more holistic digital architecture.

The last big change that I’ll point out is the addition of a new category in the Data column for Compliance and Privacy.
GDPR has been a source of much frustration and upheaval for marketers this past year. But I also believe it is serving a catalyst for important changes to marketing’s data infrastructure that will end up paying good dividends in marketing’s future.
Data quality in marketing has never been very good. Most marketers know this, but they’ve had neither the time nor the budget to address it. GDPR has forced companies to make that investment. The result will be better data and greater customer empowerment. Two big wins.
I expect this category to grow and innovate significantly in the year ahead.
A world of infinite (marketing) cloud services
Here’s the really wild thing: martech is not an anomaly. Well, not much of one at least.
The average enterprise today now uses over 1,000 cloud services across every department: marketing, sales, customer service, finance, IT, HR, etc. While I’m pretty sure marketing has the largest vendor landscape of all of them, there are hundreds and hundreds of SaaS vendors serving all of these other departments too.
As I noted last month when Salesforce acquired MuleSoft, we are effectively living in a world of infinite cloud services — there’s always +1 more you can find (or build yourself).
As result, innovation is happening not only with individual SaaS applications, but also without how companies combine them together into their own unique digital operations fabric. This is why microservices and APIs are, in my opinion, one of the biggest disruptions happening in marketing — and business in general.
The thriving category of iPaaS (integration-platform-as-a-service) solutions on the martech landscape is a testament to the immense demand for orchestrating all of these different components, making the whole greater than the sum of its parts.
As I wrote last summer, this is ushering us into a post-platform era in martech. The dream of one-suite-to-rule-them-all has been superseded by a vision of many open platform-like tools being woven together in a more dynamic fashion. Some will be big, foundational platforms; many will be small, specialized platforms. All of them will give more power to marketers to shape their craft in a digital everything world.
While that’s not without its challenges, it’s actually pretty cool.
Get chiefmartec in your inbox
Join 42,000+ marketers and martech professionals who get my latest insights and analysis.