UPDATE: The 2020 Marketing Technology Landscape is now available.
When I first presented the Rise of the Marketing Technologist, my key exhibit was a kaleidoscope of over 100 logos of marketing technology companies — what better way to viscerally express the awe-inspiring explosion of software in marketing.
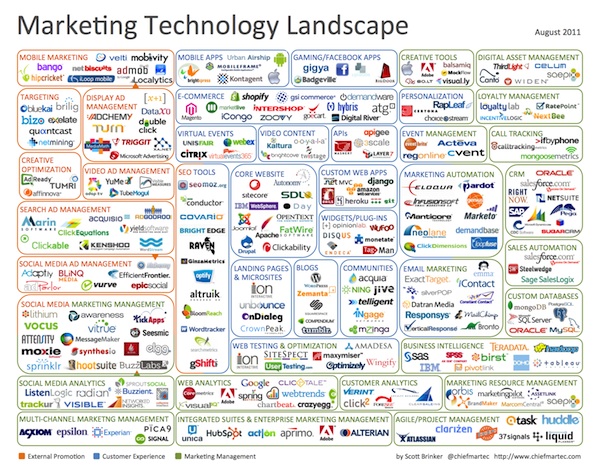
Ever since then, I’ve itched to take that hot mess of a graphic and organize it, group the products into categories, and reveal some of the underlying structure of this diverse marketing technology ecosystem. After an ungodly amount of tweaking, I’ve decided to adopt an agile approach and “ship” this first version — as imperfect as it is — and iterate and improve it with your feedback:
The categories are defined with the rounded boxes, containing logos of representative companies. In turn, these categories are grouped into three meta-categories — the orange, blue and green colors of the boxes:
- External promotion (orange) such as advertising and social media marketing
- Customer experience (blue) that you operate and control, such as your website
- Marketing management (green) that runs the organization behind the scenes
Many of the challenges I faced in assembling this infographic felt like a metaphor for what marketing technologists wrestle with every day — given time and space constraints, I could only address a subset of possible categories, and in each category, I could only include a fraction of the vendors offering solutions in that space.
First and foremost, there is way more marketing software than what is represented here. This is just a subjective sampling, of primarily web-based, SaaS, and digital-centric applications. I apologize if I didn’t include your favorite — feel free to tell me about it in the comments. New marketing technologies are being released every week, so any static snapshot like this is bound to be out of date the moment it is published.
There are more categories of marketing software, but I strived to capture the major ones that would be applicable to the largest number of B2B and B2C marketers. I have not done justice to the technologies used by agencies or publishers. I did, however, include not only off-the-shelf products, but also some technologies used by marketers to build their own applications (e.g., the categories for Custom Web Apps, Mobile Apps, and Custom Databases).
The names of categories are squishy, as the definitions are constantly changing. I tried to choose the most commonly known names for categories. However, Eloqua might make the case that they should be in a Revenue Performance Management category instead of Marketing Automation. My own company, ion interactive — disclaimer, I included us in this diagram — is in the Landing Pages & Microsites and Web Testing & Optimization categories, even though I would prefer a separate Post-Click Marketing category.
As an inevitable corollary, many companies cross multiple categories. Some entire categories are intermingling, such as Search Ad Management and Social Media Ad Management, which I indicated with adjacency and occasionally small arrows. Alas, some cross-pollination defied my ability to show it cleanly in two dimensions, such as the intersection of CRM and Social Media Marketing Management into a new generation of social CRMs. Robust M&A activity has complicated categorization too. For most hybrid companies, I placed them in what I perceived as their primary category, although I put a few in multiple for clarity. If you disagree with my categorization, please share your rationale for a rearrangement.
Some categories are incredibly diverse. For instance, Integrated Suites includes both Hubspot and Unica (now a part of IBM), which serve two very different extremes, from SMBs to large-scale enterprises. I also included related technologies in categories that I thought were relevant — such as Zemanta in Blogs and Hadoop in Business Intelligence — even though they’re qualitatively different than their “peers.” I have a couple of catch-all categories — notably Widgets/Plug-ins, whose only common thread is that they provide capabilities that can be plugged into existing web properties.
Note: slight variations in the size of logos doesn’t mean that I prefer one over another, or that one is a larger company than the other; more mundanely, it was simply a little aesthetic license to squeeze things in. I chose logos over a list of names because I felt it was a better reflection of their respective differentiation.
Finally, I must give a nod to Terence Kawaja of LUMA Partners, whose LUMAscapes gave me inspiration for how to arrange this landscape. Terence’s graphics are much more complete than mine, especially because each focuses on a more narrow slice of the industry.
What do you think? What should I fix in the next version?


I like it. Very well organized. I’m not sure how you did it without giving yourself an aneurysm. My only suggestion would be to replace the Day Software logo in “Core Website” with Adobe. Adobe has acquired Day and the two are pretty well integrated now.
I think the “personalization” category could be better. You have “targeted product recommendations” with companies such as Certona, and then you have behavioural targeting, like Rapleaf.
Finally, you have “true personalization” with companies such as PredictiveIntent (www.predictiveintent.com), where any digital touchpoint can be adapted in any format with any content based on any visitor data.
Drop me an email if you’d like to learn more about the latter!
Tremendous work, Scott! Thanks a lot for sharing. I’ve been working on the same kind of key player mapping for +3months and regret not to have found yours before… I know well the amount of work and the difficulty of categorization behind this kind of diagram. Sincere congrats!
Among different little details, may I suggest you some important missings?
IMHO, you should add
> Into the API square : RunMyProcess
> SEO square : Yooda
> Emailing : Emailvision
…
Love this. This task is particularly difficult when the lines are being blurred with new innovation (Eg. CMS capable of A/B testing). I would include Voice of the customer (Foresee, iPerceptions).
This is very interesting! This can be an invaluable resource when people are looking for marketing solutions but are not specific about what they may need. Have you thought about adding Marketing Intelligence or Business Analytics? There are solutions that focus on helping marketing departments measure, correlate, and report on disparate data feeds from the channels (online and offline) used in campaigns. Understanding how channels affect one another and impact a campaign overall is key in maximizing resources to ensure positive ROI. The company I work for, Anametrix is one of them 🙂
Good diagram and a very complex space.
Luma Partners started this and has some great diagrams broken down.
http://www.lumapartners.com/resource-center/
If you also have not seen Terry Kawaya present this look it up.
Great infographic, must have been a ton of work! As discussed on twitter, we missed our company in it, see http://www.gxsoftware.com. Two products; WebManager which is core website, and BlueConic, which does online customer engagement. That one is hard to place in this infographic, I would think Optimization fits the most. And maybe add jquery (custom web apps), phonegap (mobile apps)? Are you intending to update this infographic regularly?
Great work. Will help us in setting up our marketingplan.
good representation of a complex space. The one thing that stands out to me is how little is focused on Facebook despite its relative importance. I’d love to see a similar chart just focused on the Facebook platform
I agree with the comment that you need business analytics in there. I think specifically about predictive and adaptive analytics models that use customer data to drive very personalized and customer-centric marketing campaigns. Another key area to put into the diagram that is related to MRM, marketing automation, and integrated enterprise marketing is Business Process Management. Companies that apply a process-centric approach to marketing can empower marketers to be very adaptive to customer needs. Perhaps a sub-component of this would be case management software. Some of the latest and greatest in case management allows organizations to “learn as they go” and create dynamic and flexible case processes that allow multiple people to work on very complex and ad-hoc work. Marketing campaigns could greatly benefit from strong business process.
Great work Scott. I love the graphic. Omniture seems like it belongs in the web analytics category.
Hi,
Hard to conceive the work and thought that has to go into something like this but, as a representative of TagMan, we have to say we always find them uncomfortable. While pleased to be on the chart in the first place, tag management is so fundamental as to never fit in one bucket.
Tags enable almost all the things on this chart – managing the tags means better ability to manage all those things. So, given these buckets, we ourselves would find it almost impossible to pick one to sit in. I’d have to go for ‘Core Website’ I guess since that’s where the universal container sits.
All the best,
Hat’s off to you Scott,
Your slide impressed upon me the embedded complexity in Marketing, and the many different decision check points customers have to evaluate regarding which assortment of capabilities to leverage for their organization. Then the added time the customer has to plan and resources they have to engage to: Research, Study, Evaluate, and Arrange a POC around and internally Debate in terms of the business value to be realized.
This slide strikes me as incredible investment in time, before any customer can begin to build a defensible business case to present to their leadership team. Smarter Commerce is aimed at simplifying this picture, and reducing the time to execution. I would encourage Marketing and Commerce Executives to listen to the opening and closing sessions of the Smarter Commerce Global Summit. Companies are making progress!
I just poised a question to a few of the groups I belong to on LinkedIn on how much time would practitioners estimates it takes a company to review, evaluate, acquire, and then deploy any, or all of the 40+ capabilities and I would welcome feedback from this community.
Great picture but it should be a one page website on its own with regular updates and addition (e.g. I don’t see aweber in the email marketing area) http://sandrostudio.com
Wow! I have been looking to this information for a long time. Thank you for sharing. The diagram is missing an important disruptive technology – Customer State Marketing.
Keep the great posts coming.
I also think this is really well done. You missed one category… marketing mix/marketing planning. One of the fundamental questions for marketers is how to get the best return from their budget. They ask that before they get into many of the execution categories in your diagram. For years, that sort of work was the domain of consultants, but now there are software-as-a-service offerings that combine market data, consumer behavior data, company data and other factors so that marketers can simulate the results from various marketing plan alternatives and allocate resources across the categories in the diagram in the smartest way and quickly run new scenarios as new data comes in and adjust the plan if needed. This type of software is just what the “agile marketer” you talk about in one of your other posts has to have.
Hmmm…Some 42 different categories of technologies. As if marketers’ lives weren’t complex enough, now they have to make decisions on choice of technology to invest in, acquiring new skills (to manage these technologies), deal (duel??) with CTOs/ CFOs, make sense of the ever increasing jargon and terminology around marketing automation (MRM/ MOM/ DAM/ MAM/ SMM….whoa!!).
I wonder how many of these technologies are super critical/ must-haves if you were running marketing a) a large enterprise b) an SMB c) a start-up? Add another dimension B2C vs B2B…Not to speak of industry verticals (FMCG vs. Insurance vs. Automotive vs. software services….). What other organizational process – manufacturing/ supply chain/ finance & accounting/ HR has this complexity of technology categories to deal with??
As Scott himself says “New marketing technologies are being released every week, so any static snapshot like this is bound to be out of date the moment it is published”…By the time you make a decision to go for a specific technology/ specific vendor and have the system implemented, it’s outdated or out of fashion?? IF the CMO survives in the organization long enough that is (average CMO tenure in an organization was about 18-24 months is what I read recently…)
What’s all this really mean for CMOs and their organizations??
My CMO just hired 24 new people…one to handle each of those boxes. I’m the IT guy, and it’s almost impossible to service everyone.
THANKS JACK FOR ALL THE INFO
Thanks for this. As the marketing manager for a a global Integrated suite of communications and marketing management tools called XMPie (http://www.xmpie.com) – I would like to know where you sourced the information for the table and how I can get XMpie into the mix.
Very interesting infographic Scott! I can imagine that took quite a bit of effort to get the logos arranged correctly 🙂 Well done!
I would like to suggest a couple of additions. Streamsend http://www.streamsend.com for the Email Marketing category, and also our own product Mikogo http://www.mikogo.com which is a desktop sharing program. As you pointed out about many of the products, Mikogo would also cross several areas in marketing as well as sales, but I think “Virtual Events” is best in terms of your infographic.
Once again, good work on the infographic!
Regards,
Andrew
I see you have CRM in there but nothing with Business Support Systems like “Billing” which is fast becoming a strategic asset as a touch point to first establish a customer relationship and then ongoing as a means to cultivate that relationship. The real-time rating and charging aspects of systems like ours (www.tractbilling.com) help marketers in real time see what the actual usage and behavior patterns are (what “activities” people are engaged in–invaluable for upsell, cross-sell and development of new services.
Great information for marketers. There are more than a few on this list that I would give 5 stars to. There is something for every size company on the lists whether you work with enterprise size business, mid-sized or small businesses.
Would it be possible to get a high res image of this for internal education use? Thanks- Julie Malone
julie.malone@draftfcb.com
Scott: my comment is long overdue! I have looked and dissected this infographic rich on so much information and even more than that: it captures the complexity, diversity of this digital ecosystem, which truly popped up in the last 5 years! I wonder if you are going to “update” this monumental piece of work you have already done and yes I would also love to have a high resolution copy of this wonderful digital technology infographic: the best I have ever seen: thank you for your very hard work
Regards from Hamburg Germany to you!
I love this graphic. Is there one trade show that offers representation across this landscape? It looks like there are options overseas http://www.t-f-m.co.uk/page.cfm/link=1
Is there something similar that is offered domestically (US)?
Indeed, this information is effective for marketers and those who are interesting in marketing technology, Just like me.In above list there are very few of them who are belong to 5 star category.
Very amazing infographic Scott! I can believed that took quite a bit of effort to get the logos arranged correctly.
Scott, this is amazing, how would a company go about being considered to be included on the next update?