Happy #MartechDay to you!
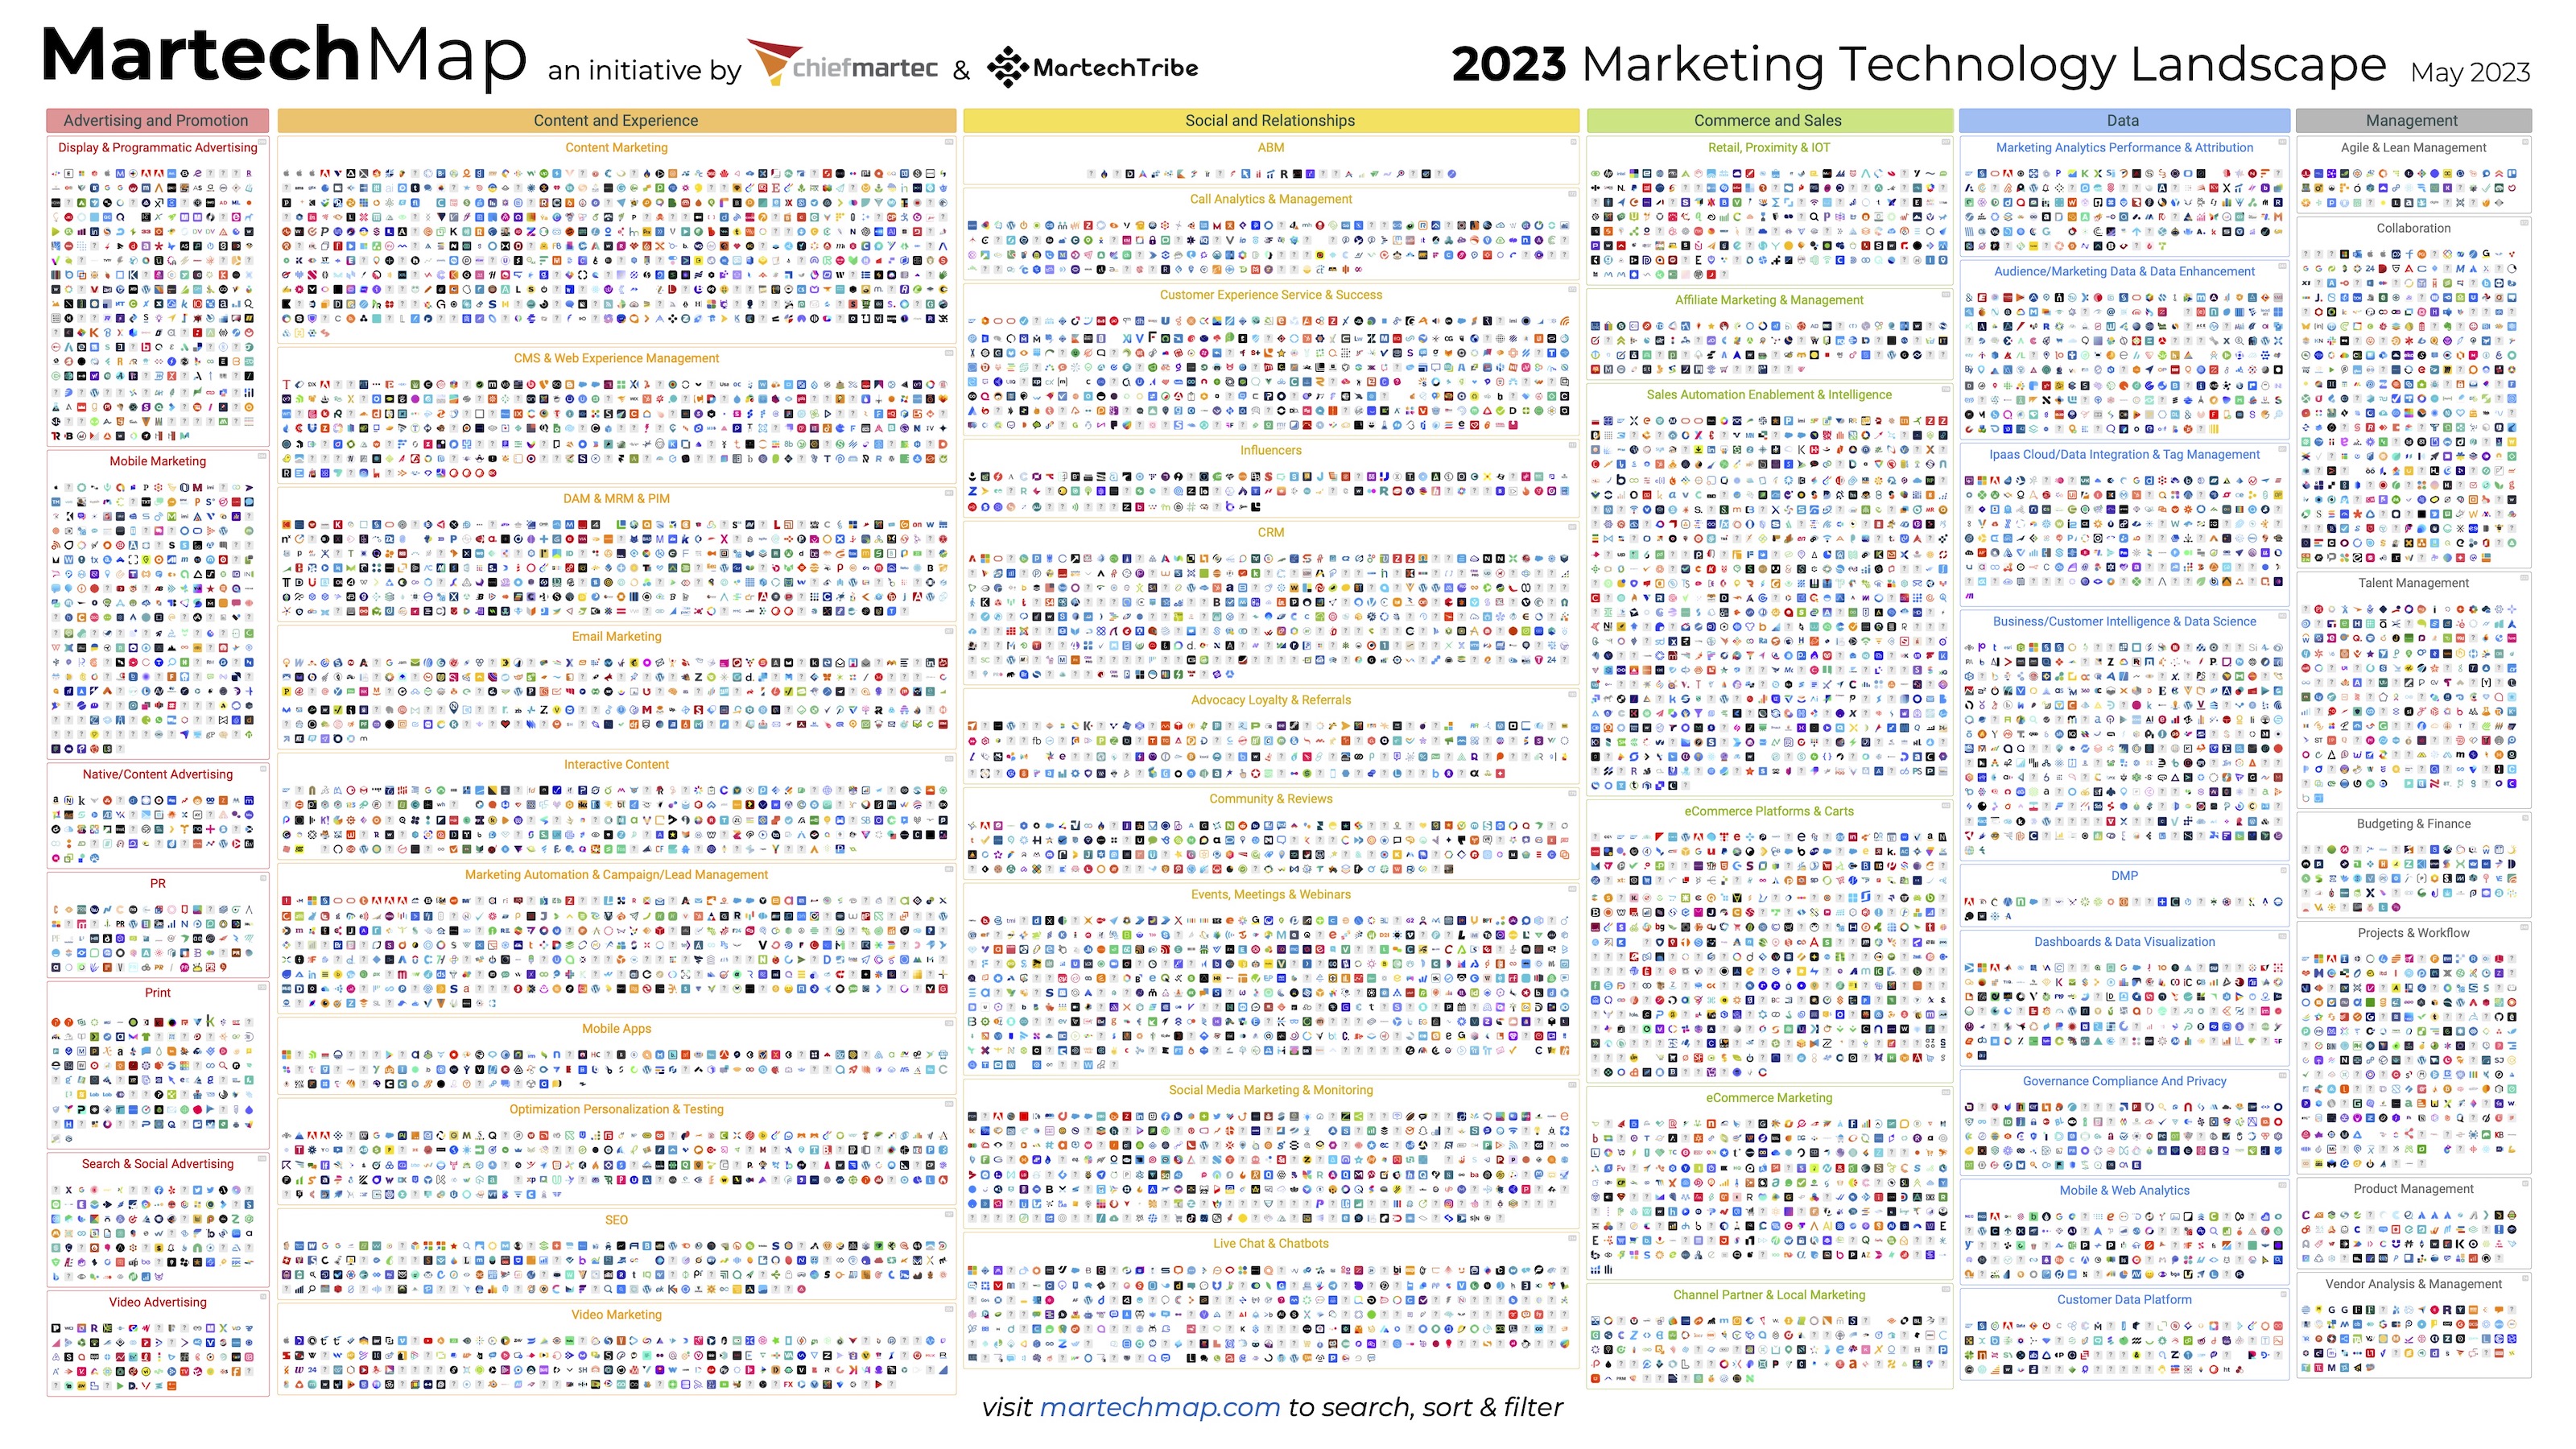
Today during our virtual Best of Breed Marketing Summit — you can still catch sessions on demand for this next week — Frans Riemersma and I released the 2023 edition of the marketing technology landscape.
You can download a hi-res slide of the landscape or even a super hi-res PDF. But the best way to dig into the landscape is to use the free interactive version on martechmap.com.
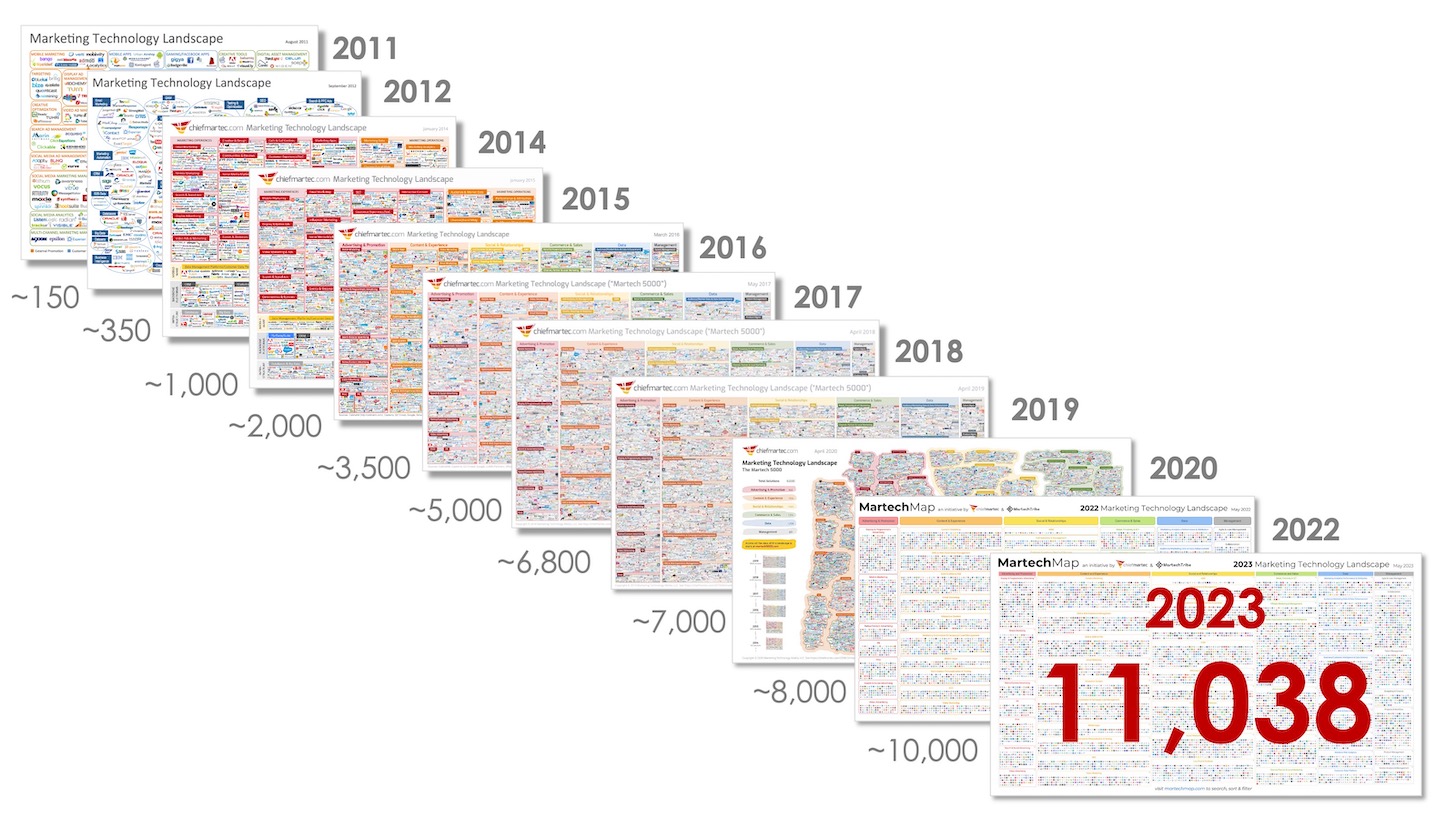
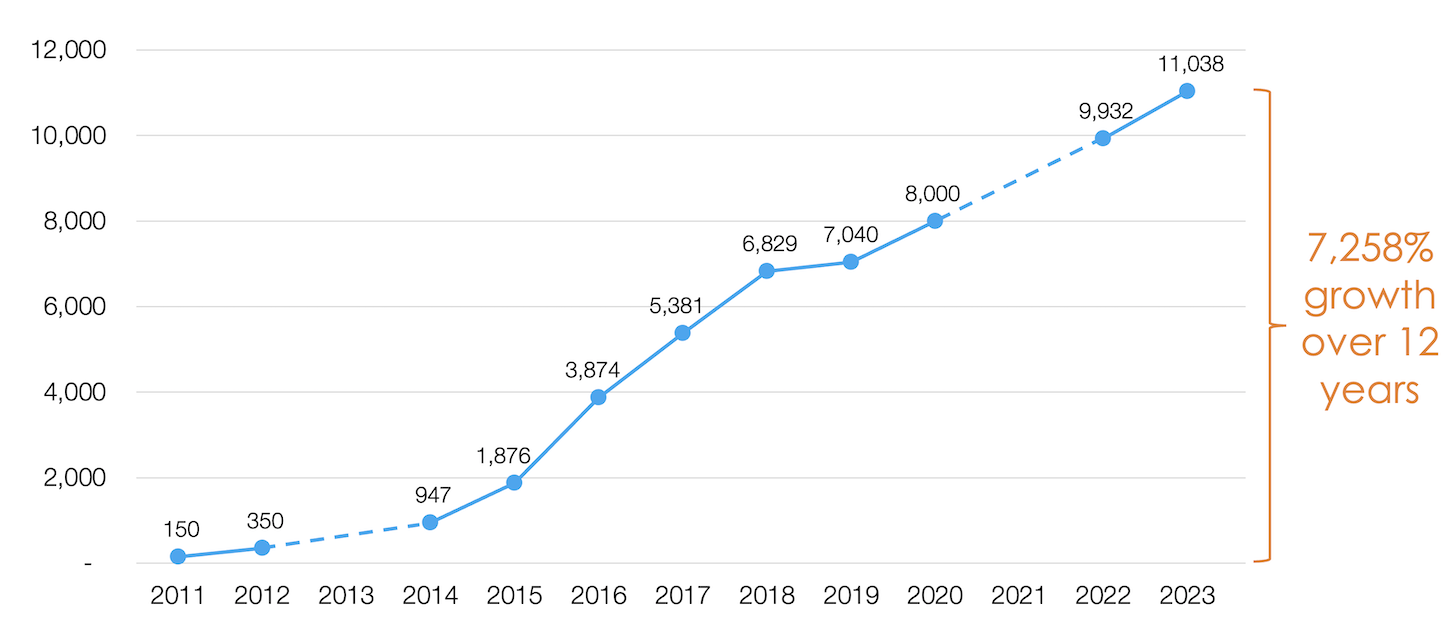
It perhaps comes as no surprise that the martech landscape grew yet again, for the 12th consecutive year in a row. It now contains 11,038 solutions — an 11% increase from the 9,932 we charted last year.
Maybe it should come as a surprise, given how rough of a year 2022 was for many SaaS companies. And in fact, we removed 689 companies from last year’s landscape — a 7% churn rate — that were acquired, pivoted out of martech, or went out of business.
But it’s the same dualistic story we’ve seen for the past 12 years in martech. Yes, there is consolidation and churn. Even significant consolidation and churn. But the rate at which new startups have launched has consistently outpaced the exit rate of those who leave the arena, whether victorious or dead.
While competition grows and economic pressure rises — both forces that should lead to greater compression of the landscape — barriers to entry for software products continue to fall and the size of the underpenetrated portion of the market for many of these capabilities remains tantalizingly large.
Of course, this can’t go on forever. We can safely say the upper limit on martech solutions is well below the population of the planet. (“You get a martech company! And you get a martech company!”) The rate of growth has already slowed by an order of magnitude, from 100% year-over-year to just a hair over 10%. Equilibrium seems near.
And yet, as I discussed the other week, the inflection point we’ve hit with AI-generated “software” — taking a broad and loose definition of software as any kind of digital app, experience, or workflow — has the potential to dramatically upend the dynamics of the whole industry over these next few years.
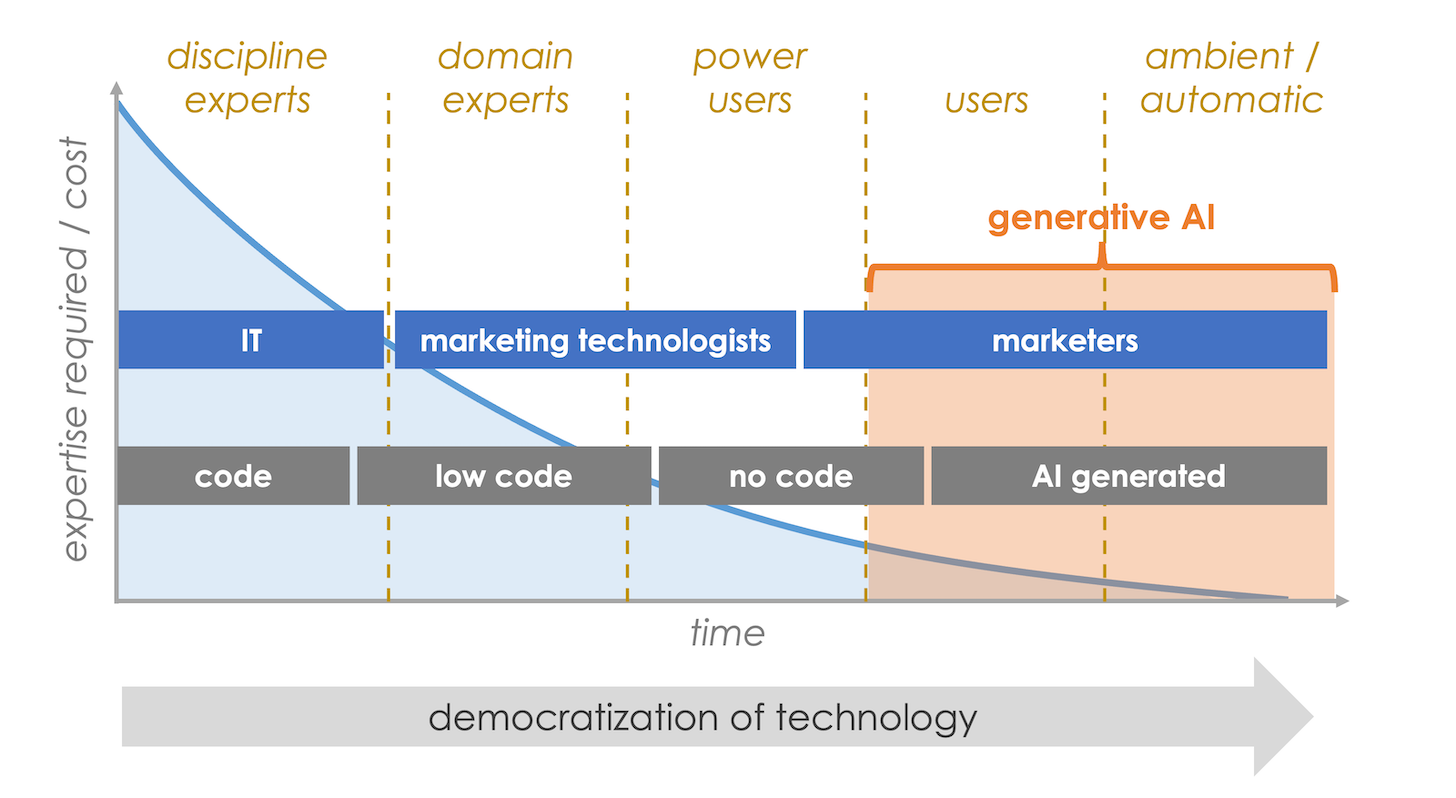
Will that shink the commercial martech landscape, as more software becomes custom composed within companies? Or will it expand the landscape with a whole new generation of martech “products” — such as a massive wave of components that can plug-and-play into these composable stack architectures?
Honestly, it could go either way. But if I had to take a guess, I think it will be the latter.
Major Upgrades to MartechMap.com
In the meantime, as you look to explore the current martech landscape, our interactive martechmap.com site has some seriously sweet upgrades for you that were released today.
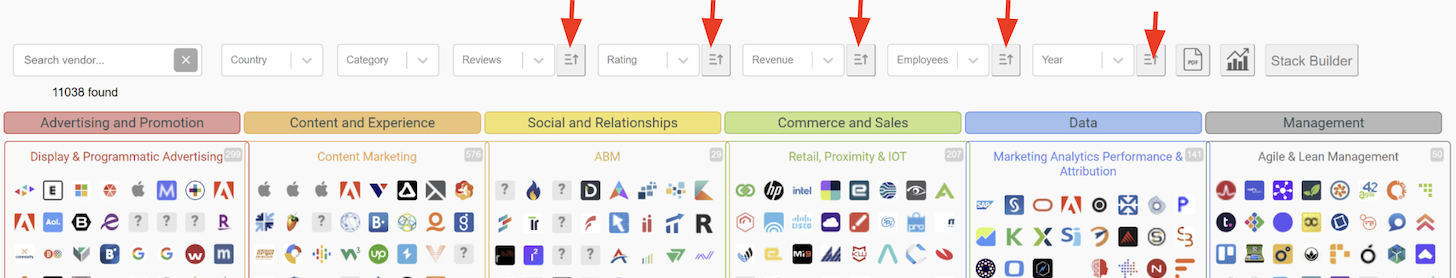
As before, you can search the entire database and filter martech solutions by country, ratings and reviews (thanks to our data partner G2), year founded, and estimated revenue and number of employees (thanks to our other data partner Clearbit). But now, you can also sort the results by any of those fields too:
We know that martech is a long tail, with a small number of larger companies in the fat head, scale-ups in the “chubby middle”, and then a long, long, long tail of startups and niche specialist apps. But the distribution of that long tail varies from category to category. Some have one winner. Some have an oligopoly of several. And others are duking it out in more evenly divided spaces.
With the click of a button, you can now see a pie chart distribution of the top 10 companies by revenue in each category (thank you again, Clearbit, for the revenue estimates). Hover over each section of the pie to see the company and their revenue share. There are also averages for reviews, ratings, revenue, employees, and age.
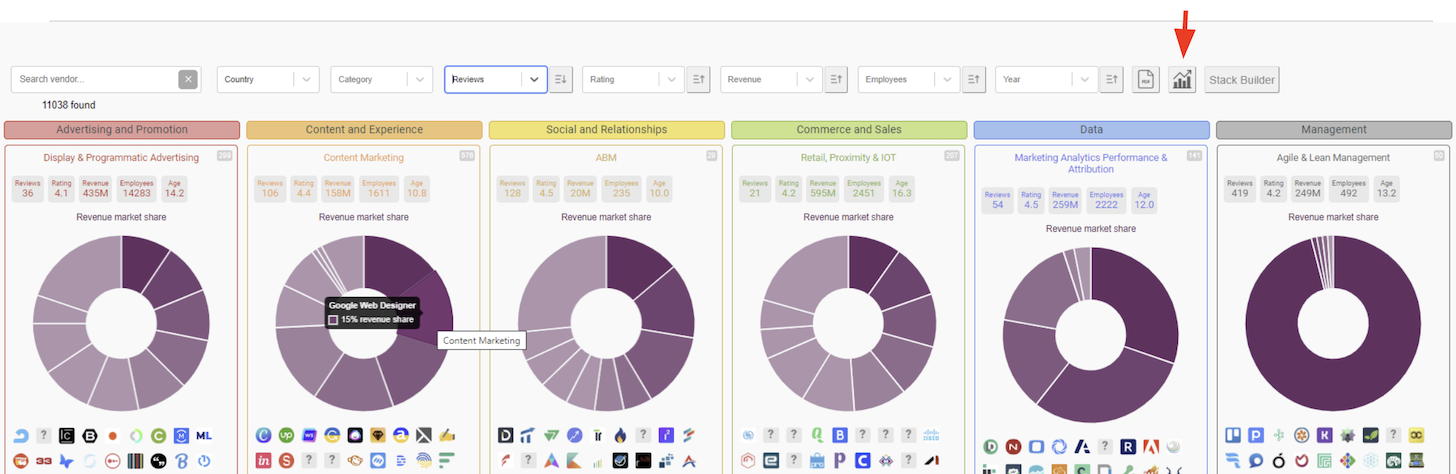
And here’s something really cool: if you apply any of the filters — say on country, or ratings, or number of employees — the pie charts and averages will dynamically adjust to show the data for just the filtered companies. For example, want to know the largest ABM company based in Germany? Filter by country, and you’ll instantly see it.
Even with just estimated data, and not fully complete for all companies in the database, it’s still a useful lens.
Oh, as Steve Jobs famously said, “One more thing…”
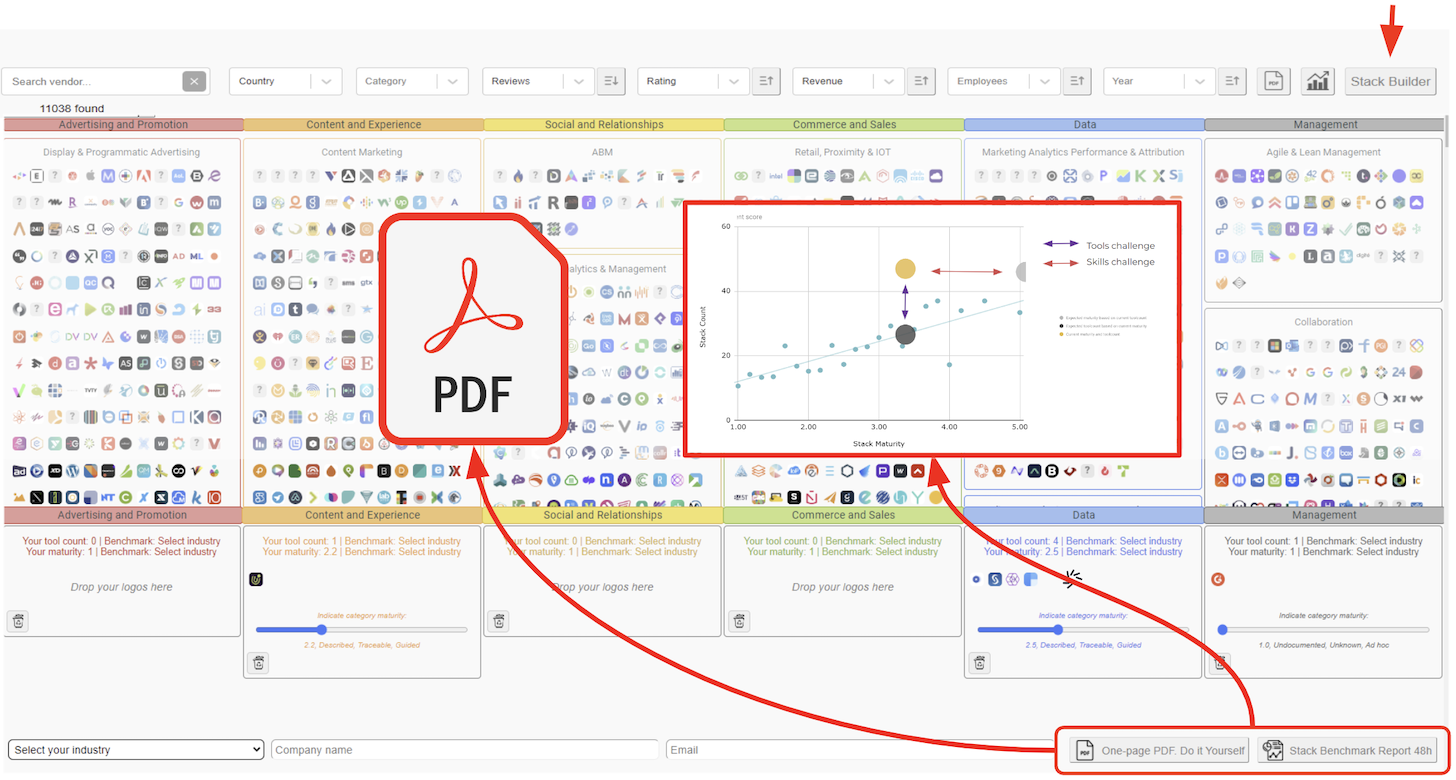
We’ve also added a stack builder, which lets you drag-and-drop solutions from the map into your own stack — whether real or hypothetical. You can also indicate your company’s relative maturity in leveraging each of these categories, which lets you compare your overall martech stack maturity against a database of hundreds of other companies. You can get a PDF version of your assembled stack — or send a request for a benchmark report, compliments of MartechTribe.
For now, consider these features in beta, and let us know if you run into any issues.