Because I’m a rambling blogger and not a professional journalist, I’m going to bury the lede — that a recent Gartner report shows larger companies spending more on marketing technology than advertising this year — but I promise to get to it eventually. (Actually, I guess with this disclaimer I didn’t bury the lede. But I digress.)
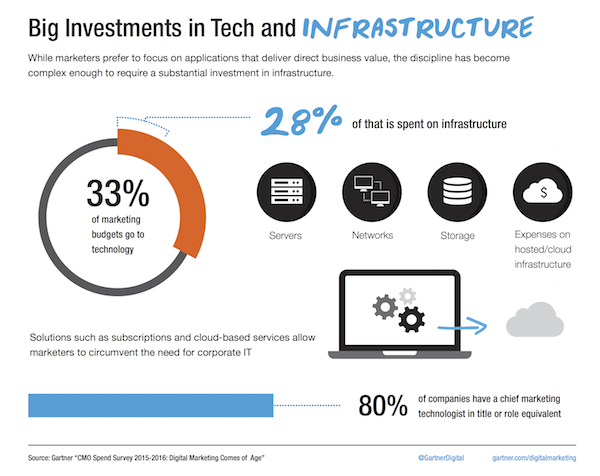
Gartner recently released their CMO Spend Survey 2015-2016, and, of course, I immediately turned to the page on technology investment (pictured above), which had three remarkable revelations:
- Marketing technology represents 33% of the marketing budget.
- 28% of marketing technology spend goes to infrastructure (e.g., servers, storage, network) to run marketing software.
- 80% of firms (still) report having a “chief marketing technologist” role.
Those first two points were actually somewhat surprising to me.
The first question in my mind was: what kinds of companies do these figures represent? Gartner’s survey was based on the responses of 339 marketers from the following industries: financial services (83 respondents), high tech (90), manufacturing (31), consumer goods (30), media (26); retail (62) and transportation and hospitality (17). Respondents came from companies with annual revenue of more than $500 million. Median annual revenue of these companies was $3.5 billion. Respondents were from the U.S., Canada and the U.K.
In other words: large companies, but a broad mix of both B2B and B2C.
On average, they each have total marketing budgets of around $385 million, representing 11% of their annual revenue. (That’s up from 10% of revenue allocated to marketing in Gartner’s 2014-2015 survey.)
This translates into marketing technology budgets of $127.7 million on average.
If you do a very loose back-of-the-envelope calculation — 339 companies with an average $127.7 million marketing technology budget each — that would be around $43 billion in marketing technology spend among these participants. Now, since we’re dealing with medians and not means, and I don’t have access to the raw data, that’s a pretty loose calculation. But as a ballpark figure, it’s conceivably in the right neighborhood. (As a Robert DeNiro character once said, “That’s a very respectable neighborhood.”)
So the second question I had was: what’s in that marketing technology budget?
I reached out to Jake Sorofman, research vice president at Gartner, who kindly provided a more detailed breakdown. The median marketing technology budget of $127.7 million was allocated as follows:
- Marketing and analytics software purchased as a service (24.4%)
- Infrastructure (e.g., servers, storage, network) to run marketing software (28%)
- Cross-charges for IT (21.3%)
- External services to develop, implement, and integrate marketing applications (25.2%)
- Other (1.1%)
As Gartner pointed out in their report, the fact that infrastructure is the largest marketing technology expense is kind of remarkable. More apps, more bandwidth, more computation, more data, etc. Even as cloud-based infrastructure gets cheaper, we’re consuming more of it.
I also found it notable that 21.3% of marketing technology budget goes to cross-charges for IT. On average, that’s $27.2 million a year. So that’s certainly strong evidence that marketing and IT are collaborating on a lot of projects, which is good. Just because marketing is spending a tremendous amount on technology doesn’t mean it’s replaced or sidelined the IT department.
At the same time, 25.2% also goes to external services to develop, implement, and integrate marketing applications. Marketing is spending more on external technology services than internal IT services. Hopefully the decision of internal vs. external resources is made through enlightened consideration of comparative advantage and a firm’s core competencies. (Hey, I’m an optimist.)
And collectively, between internal and external providers, 46.5% of the marketing technology budget is spent on services — which is nearly 90% more than what is spent on marketing and analytics software-as-a-service.
Very intriguing findings.
But, as promised, the most fascinating finding was the answer to this question: if 33% of the marketing budget is spent on marketing technology, where’s the other 67% going?
Jake kindly shared this information on overall marketing budgets too:
- Labor — 35%
- Marketing technology — 33%
- External marketing services (e.g., advertising, paid search, consulting) — 32%
Note that advertising is just a portion of the external marketing services budget, some fraction of 32%. Therefore:
advertising (fraction of 32%) < marketing technology (33%)
Given the respective trajectories of advertising and marketing technology over the past several years, this was inevitable. But still, this is marketing’s crossing of the Rubicon: the die is cast.
Pause for a moment to appreciate that. And then it’s back to the tornado…


Whoa right back. The advertising industry is around $600B per year, per eMarketer and others. Marketing technology is a small fraction of that. The stats pulled from this Gartner study are clearly incorrect on a total-market-projection basis. They might reflect the spending profiles of a certain collection of companies, but they don’t reflect overall spend. My guess would be that these are companies that don’t spend heavily on advertising, *relative to,* say, CPG, telco or automotive companies that have massive advertising budgets.
Hi, Mark.
I’m skeptical that marketing technology has exceeded all advertising spend globally too. But even if we just say it’s on average for these particular 339 U.S, Canada, and U.K. companies — assuming some spend more on advertising, some spend less — that’s still a pretty impressive figure. Even with the very broad definition of marketing technology that Gartner seems to be using.
And it cuts both ways that these participants in the Gartner study are only a small number of the total companies in the world. So while global advertising is a well-known number of $600B — way more than what is captured here — it’s not unreasonable to contemplate that global marketing technology spend (in Gartner’s broad definition) could be headed in that direction.
I’d be interested to know where healthcare numbers land more specifically since it wasn’t listed in the included industries. I don’t feel like we’ve surpassed advertising spend for tech just yet.
Click bait headline indeed and many will look around them and say “really?” – not in my hood.
However it seems that “Digital Commerce” is to a large part coming under the marketing department budgets. With “10% of marketers saying that they are expanding marketing’s role to create new digitally led business models” . This marks an official role expansion and thus there are budgets being attributed that would historically not necessarily have come under marketing technology. Can we presume then that it seems that digitalisation is the purview of the CMO amongst this survey sample?
I will add a perspective from the other side of the world – India – Having being exposed to both sides of culture – the amount of digital growth and relevance is exciting. I could safely say that the consumers have become digitally savvy and the marketing teams have to catch up some – and Technology has a large role to play. I have been following Scott’s post for the longest time.
The tussle between the CIO and CMO , and a developing role of CDO is changing the landscape and in some cases businesses may be paying the price by growth – CEO engagement ad drive is a KEY
Thanks for sharing interesting stuff indeed! Corroborates trends witnessed Cannes Lions submissions/short list.
Does anyone know of a company that spends $127M/yr on marketing tech? IDC’s CMO Advisory tracks marketing and martech spend at most of the world’s largest tech companies and they are nowhere near that, and we define martech as any tech used by marketing from spreasheets and email to campaign mgmt, data and analytics. $127M is in fact higher than their average total marketing budgets. I guess Gartner is still trying to convince us that the CMO will spend more on IT than the CIO. None of this passes the remoteness sniff test. .
Without the underlying data, I can’t offer much of an explanation for their calculations. However, it does seem like they’re including a quite a bit under that “marketing tech” category — including internal IT chargebacks and external services — which collectively is probably a pretty large bucket.
Is there any info on what those spending breakdowns look like for companies smaller than $500 million in revenue? I’d be curious how that looks and what factors might make it different.