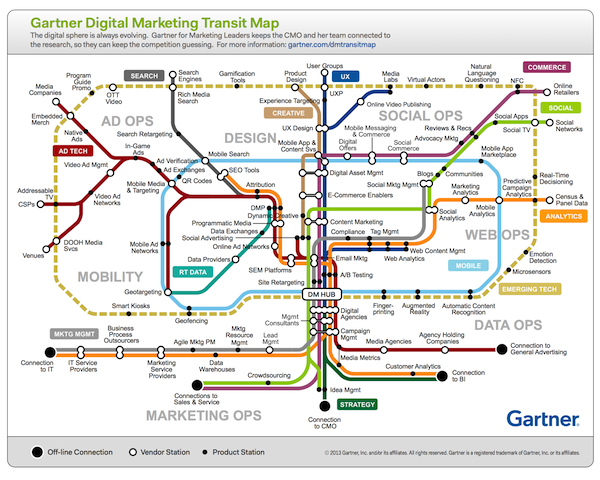
In the competition for the best visualization of the kaleidescopic marketing technology space — other entries include my marketing technology landscape from last year and the marketing technology LUMAscape from last month — I’d say Gartner has just jumped into the lead with their new digital marketing transit map.
Their high-level map is visualized around types of products and services — represented as stations on the map — rather than the individual vendors themselves. However, Gartner has cataloged more than 1,800 vendors to create this map.
It’s pretty breathtaking in scope.
There are 12 tracks, such as Marketing Management, Creative, and Analytics, which share common objectives and information. And they go through 7 neighborhoods, such as Marketing Ops, Web Ops, and Ad Ops, which are typically different practice areas within an organization. And there are offline connections to sales and service, general advertising, business intelligence, IT, and the CMO’s office.
All lines converge in a “digital marketing hub” — the central DM HUB station — in the middle of the map.
Important note: this is a human-powered transit system
Looking at this map, you cannot help but be awestruck by the breadth and depth of digital marketing. I mean, holy cats, I work in this space for a living and write this blog as my hobby — I know, I don’t get out much — and I don’t even know some of these stations. Many of them I have only a passing familiarity with.
In spite of huge deals such as Salesforce/ExactTarget and Oracle/Eloqua, it’s clear from this map — remember 1,800 different vendors were cataloged to assemble it — that marketing technology is diversifying more than it is consolidating. The Emerging Tech track alone is a source of incredible disruptive innovation ahead.
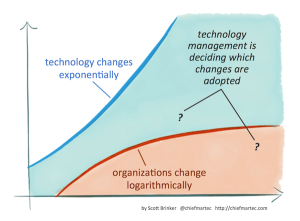
So I can fully empathize with — and have enormous respect for — marketing leaders who are struggling to sort out a cohesive strategy in this landscape. Nobody can master all of these. The real lever you have is to decide which stations you’re going to prioritize. From my post last week, this is Martec’s Law: technology changes exponentially, but organizations change logarithmically.
The art of marketing management is the strategy you use to choose which changes to focus on, and which ones you intentionally let slide, at least for the moment. And successfully implementing that strategy is far more about people and processes than it is the technologies themselves.
Which leads me to my main takeaway from this map: the “trains” are people.
There is no technology that delivers the seamless interconnectivity between these stations as it’s portrayed here. You can’t just hop the Ad Tech red line to get from native ads to attribution, transfer over to the Analytics orange line, and arrive at predictive campaign analytics in an easy 20-minute ride. The connections between these disparate stations are made via human collaboration — people and processes. It’s messy and evolutionary and varies tremendously from one organization to another.
There may be some technical plumbing, but most of it is highly informal and custom-built within each organization. (Marketing technologists are often the metaphorical plumbers.)
Most of all, there is no “DM HUB” technology today that seamlessly merges all these tracks together into the marketing equivalent of Grand Central Station. Sure, there are companies and service providers that are bringing a subset of these pieces together. But most of their strategies to date have been implemented as marketing suites rather than marketing platforms — which is like trying to hold back the ocean with a sandcastle (albeit a very elaborate one).
The digital marketing hub is an organizational entity, not a technological one.
But even in that light, this map from Gartner is extremely helpful because it visually raises the question: how are you bringing these neighborhoods together in your company? What does your digital marketing hub look like today, and what are your plans for expanding it to handle the massive influx of population ahead?
I would like to see Gartner’s recommendations on how to build this infrastructure in prioritized phases. I can see where massive enterprise marketing teams can deploy and (potentially) use many pieces of this subway map with some degree of measurable success. But not all. Where does Gartner recommend a mid-market org focus on building this transportation infrastructure? Interestingly, many orgs of all sizes are probably utilizing more pieces of these tracks than they realize. How effective they are being used is another question.
How well do you feel the Social and Sales Engagement tracks are represented?
Cheers,
Brian
Those are great questions, Brian.
For better or worse, my humble opinion is that we’re a long ways away from pat answers. I certainly agree that not every company should worry about every station in this gigantor marketechopolis — in fact most are probably best served by ruthlessly focusing on just a few of them and getting them really right. But there are clearly billions of different possible configurations to chose from.
Truthfully though, I kind of think that’s a good thing. At least in this way: I’m a big believer in the power of differentiation. And since marketing is now so entwined with customer experience — the essence of the brand — it’s probably a good thing for different companies to chose configurations that best match their overall vision and strategy.
There’s no homogenized DM HUB out there, no step-by-step playbook; but that forces companies to think carefully about what’s really important and to be creative about how they entwine these capabilities into their mission.
Doesn’t make it easy though!
As for sales, that’s a great point. Gartner’s map ends in a “connections to sales and service” — but that does short-change some of the amazing marketing-driven capabilities that are being brought to bear on sales enablement. Maybe in their next version, they’ll extend those tracks?
I like your analysis of the Transit map but do believe there are some misses. For example I think there is something missing at the intersection of social and mobile which is a very powerful space at the moment (everything my daughter does in her digital world is at this intersection). The other observation is that there is an influence the actual product and its associated commercial data has when incorporated into this model to support commerce. Perhaps this is assumed in the attribution of the product and how information is stored in the DAM.
Sales?
Hello Scott,
Have you seen the “transit map” used by Real Story Group? It appears to be more limited in scope than Gartner’s, but it’s still pretty impressive. You can see a JPEG at http://www.realstorygroup.com/images/RSG-Subway-H1-2013-Large.jpg
Sweet — thanks!
Nice to compare and contrast different visualizations like that to realize that there are many different ways to view this landscape.
Thanks for sharing the other vendor transit map David. This will be fun to compare.
An interesting Map, that just compounds the issues stated in the recent Accenture Report stating “Turbulence” as a key issue for CMO’s around the world in not really having a defined map in how they should interact with all the channels available to them within the digital space to achieve a sound ROI. Brian, you make a valid point that perhaps there should be more distilled versions of this that show clear paths of engagement needed to create success.
Coming from the world of print, I do not see this represented (although I might have had a “Boys” look) within the whole scope of communication channels sited. This fuels my belief that the focus from marketeers is still thinking digital is best without even considering the impact and open rates of personalized print as part of the whole marketing communication journey…….just saying
Thanks for sharing Scott.
I’ve had a similar visualisation printed out for a while now:
http://www.hallaminternet.com/2013/digital-marketing-tube-map-a-guide-to-internet-marketing/
Seems like a bit of a trend!
All valuable resources, some more complex than others but the transit/tube analogy is well used and helps. Not all companies can have as many trains/as busy lines as they would like, but connecting the dots with something like this is very useful.
It highlights the growing scale of Digital Marketing and the processes that at least need evaluating by professionals in a digital marketing role. Whilst your company may not use a large percentage, you need a grasp of what each element offers and how this impacts and connects with the others.
Kieron
This leaves me thinking about Einstein when he said things should be made as simple as possible and no simpler. Sorry but too complex and too pretentious.