Okta, a leading identity platform that many companies use for single sign-on (SSO), has been aggregating the data of which apps their customers use for the past five years. Every year, they publish a report that shares a wealth of fascinating stats, such as the relative popularity of different apps. This is another example of ground-truth empirical data about tech stacks that I find highly credible.
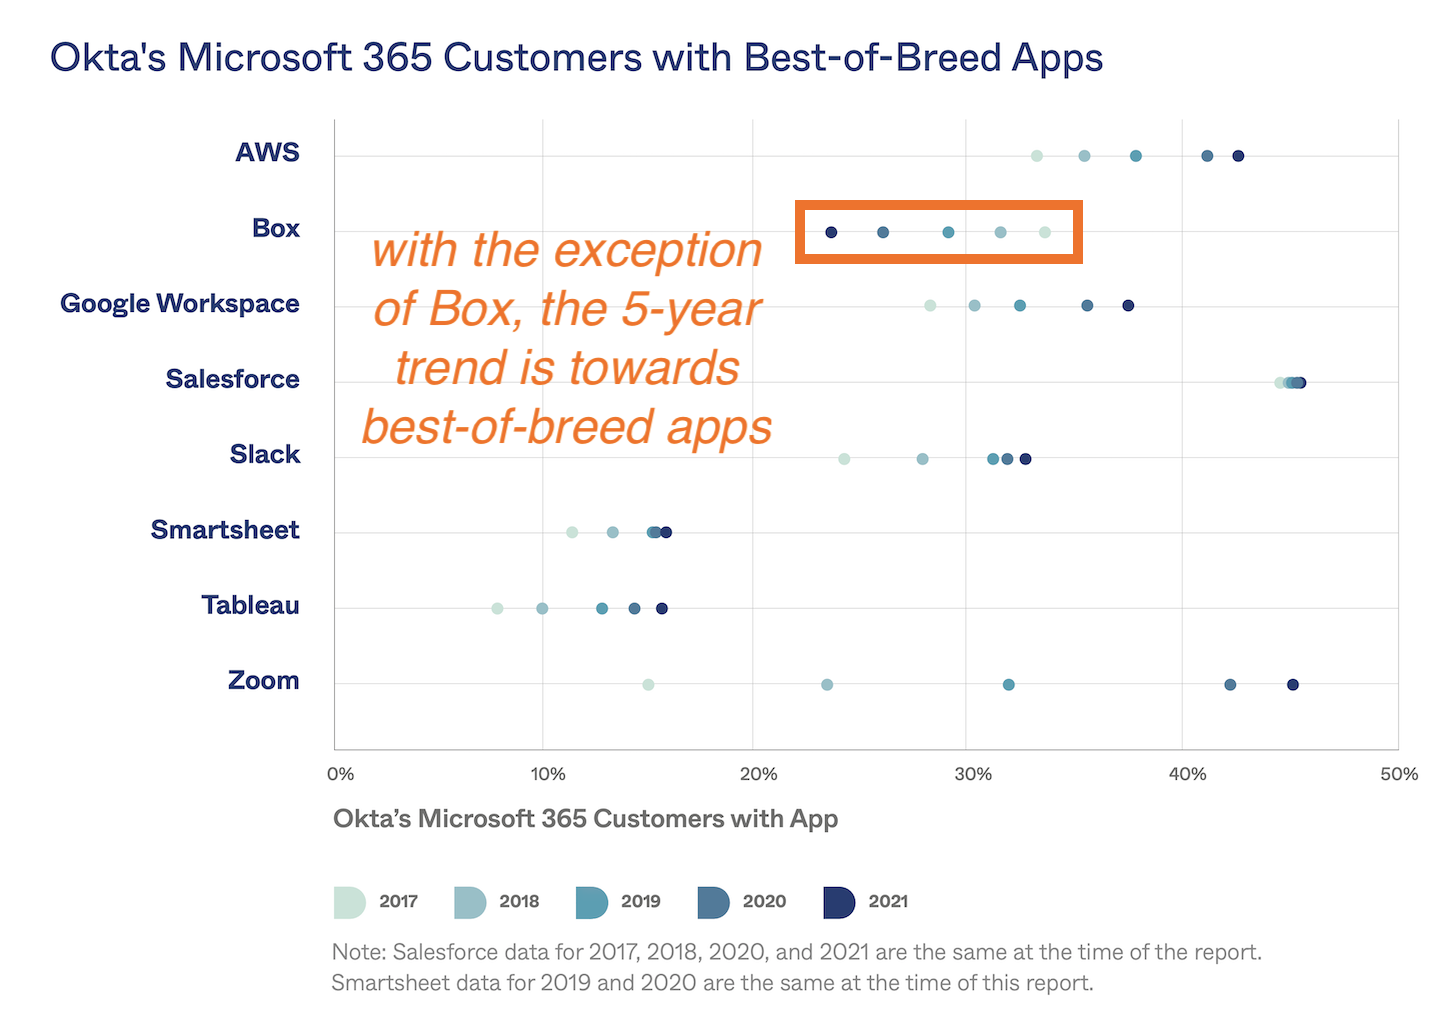
In the 2022 edition of Okta’s report, just released, the most interesting chart is the one I’ve excerpted above. It shows that companies who use Microsoft 365 apps and platforms — which collectively span everything from docs and spreadsheets to development platforms and videoconferencing — have also been increasing their adoption of “overlapping” apps and platforms from other companies.
Yes, they are Microsoft 365 customers. But some prefer AWS over Azure. Or Salesforce over Dynamics. Or Slack and Zoom over Teams. Or Smartsheet over Excel. Or Tableau over PowerBI.
For each of those apps, you can follow their light-to-dark-colored dots in the chart steadily sliding left to right, year-over-year. The adoption of best-of-breed apps, at least within the context of Microsoft 365, has unmistakably been growing.
With the exception of Box, which has been going in the exact opposite direction (sorry, Box). I personally like Box, and their CEO’s Twitter account is pure gold. But out of all the apps in the list, it seems to me their core product might be the easiest for Microsoft to commoditize from within the Office 365 environment.
Is this best-of-breed trend representative of stacks overall, especially for martech?
It certainly aligns with the continued growth in stacks we’ve seen in other aggregate data from the SaaS Management Platforms. And many of the apps overlapping with Microsoft 365 are part of the martech world.
But I can hear the objection to the methodology. “Hey, just because I use Microsoft Word doesn’t mean that I want to use Microsoft Dynamics as my CRM. Those are apples and oranges!”
Fair enough. But it’s an interesting thought experiment. If the world’s second-largest, $2.3 trillion software company — and the world’s first-largest, $2.8 trillion Apple, who doesn’t even touch most of these app categories — can’t satisfy you with everything from their portfolio, then who could? And if you reply that it all depends on the natural boundaries of categories, because clearly documents are different than CRM records, I would humbly note that delineating those so-called natural boundaries gets harder as categories get closer to each other.
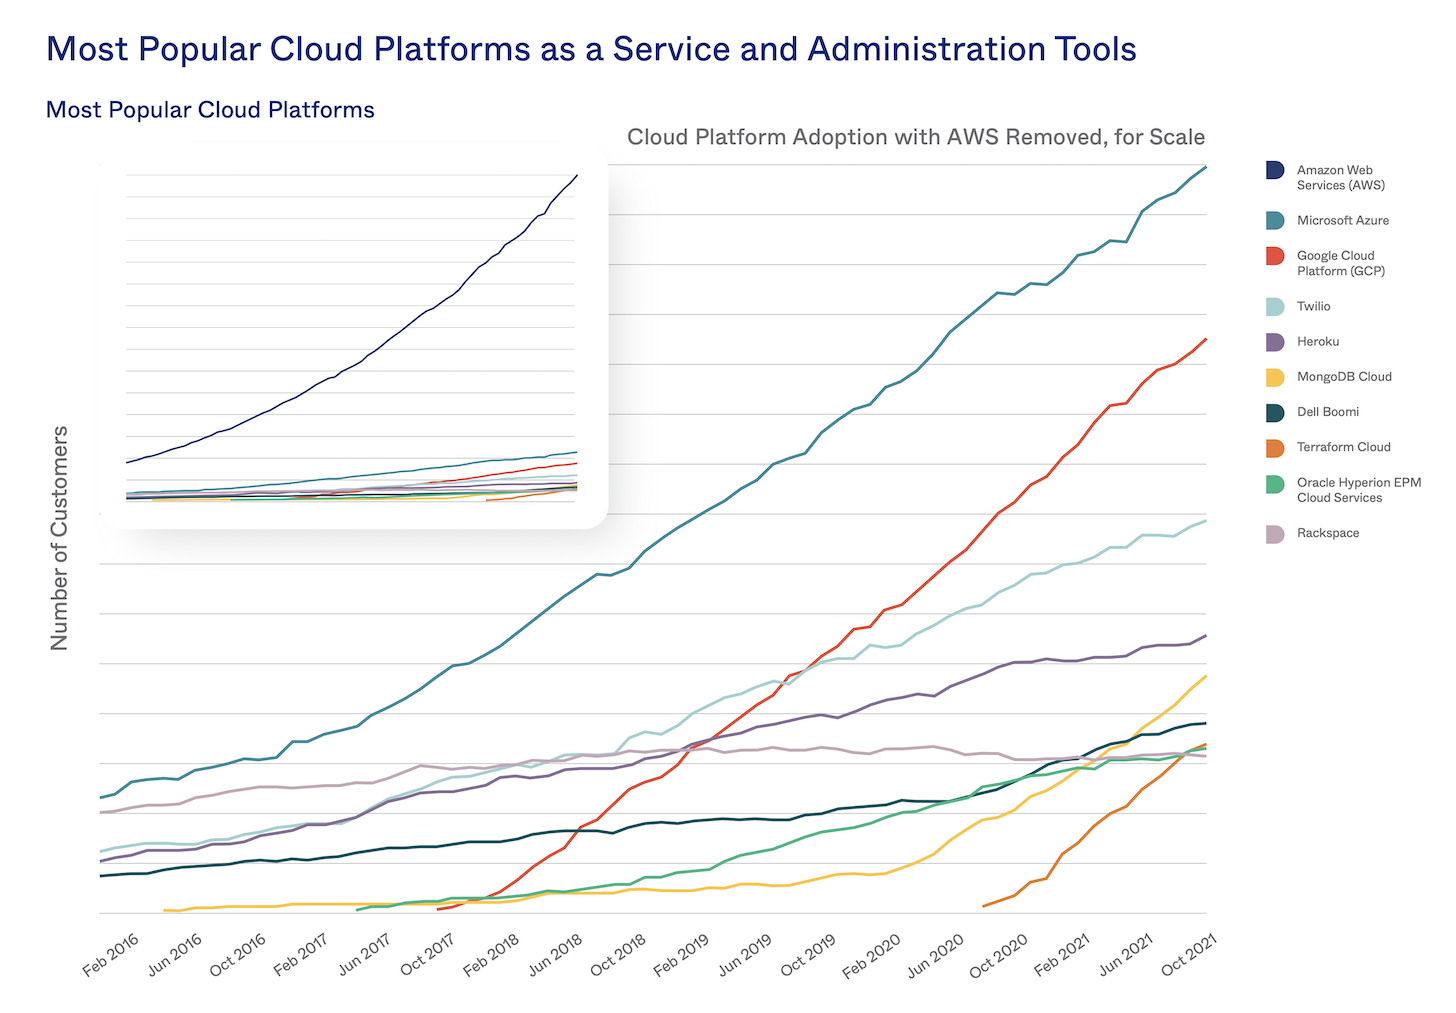
One other chart from that Okta report that I’d like to highlight:

This is the growth of adoption of major cloud platforms, such as AWS and Azure, being connected through Okta. Two things worth noting:
First — wowzers — the distance between AWS and everyone else is stunning.
But second, and more relevant to my narrative, the growth in adoption of all of these cloud platforms — steep up-and-to-the-right climbs — is growth in their use by developers to create more software. They are the engine behind The Great App Explosion. And more and more of that app explosion is custom-built.
If you follow those trend lines, they lead to a world of more software diversity, not less.
Now for the kind request I have of you…
Our Annual Martech Career Survey

If you enjoy my posts and would like to help our martech community, I’d ask this favor of you: please take a couple of minutes to complete this 2022 Martech Salary and Career Survey that I’m conducting again with my friends at Martech.org. The more martech pros like yourself who participate, the greater the n of the our study, and the more significant the results will be.
We’ll then publish the aggregate results for everyone to read. I’m super curious to see the results. Aren’t you?
Thank you for your help.
Get chiefmartec in your inbox
Join 42,000+ marketers and martech professionals who get my latest insights and analysis.