Spring is one of my favorite times of year in the martech industry.
We release the latest marketing technology landscape. We share the latest data on martech careers and job responsibilities. We — in normal times — run the MarTech Conference in the Bay Area. And at that conference, we announce the winners of The Stackies: Marketing Stack Awards and share dozens of amazing stack illustrations from startups through Fortune 500 brands. (Check out the ones from 2016, 2017, 2018, and 2019.)
Unfortunately, the in-person MarTech Conference couldn’t happen this month. So we decided to postpone The Stackies awards ceremony until our next event this fall in Boston. (The good news: we have extended the deadline for entries now to September 18 — so you still have time to participate.)
However, we did receive dozens of amazing entries by our original March deadline. Thank you to everyone who contributed! We’ll have a special awards pool for those participants in the fall. But since there are just so many cool ones that came in, we can’t resist giving you a “sneak peek” into the full set you can expect to see in the fall.
We already shared with you early entries from Nexthink, who created an interactive “periodic table of martech,” and Red Hat, who mapped out an insightful customer journey stack and the tools they use within it.
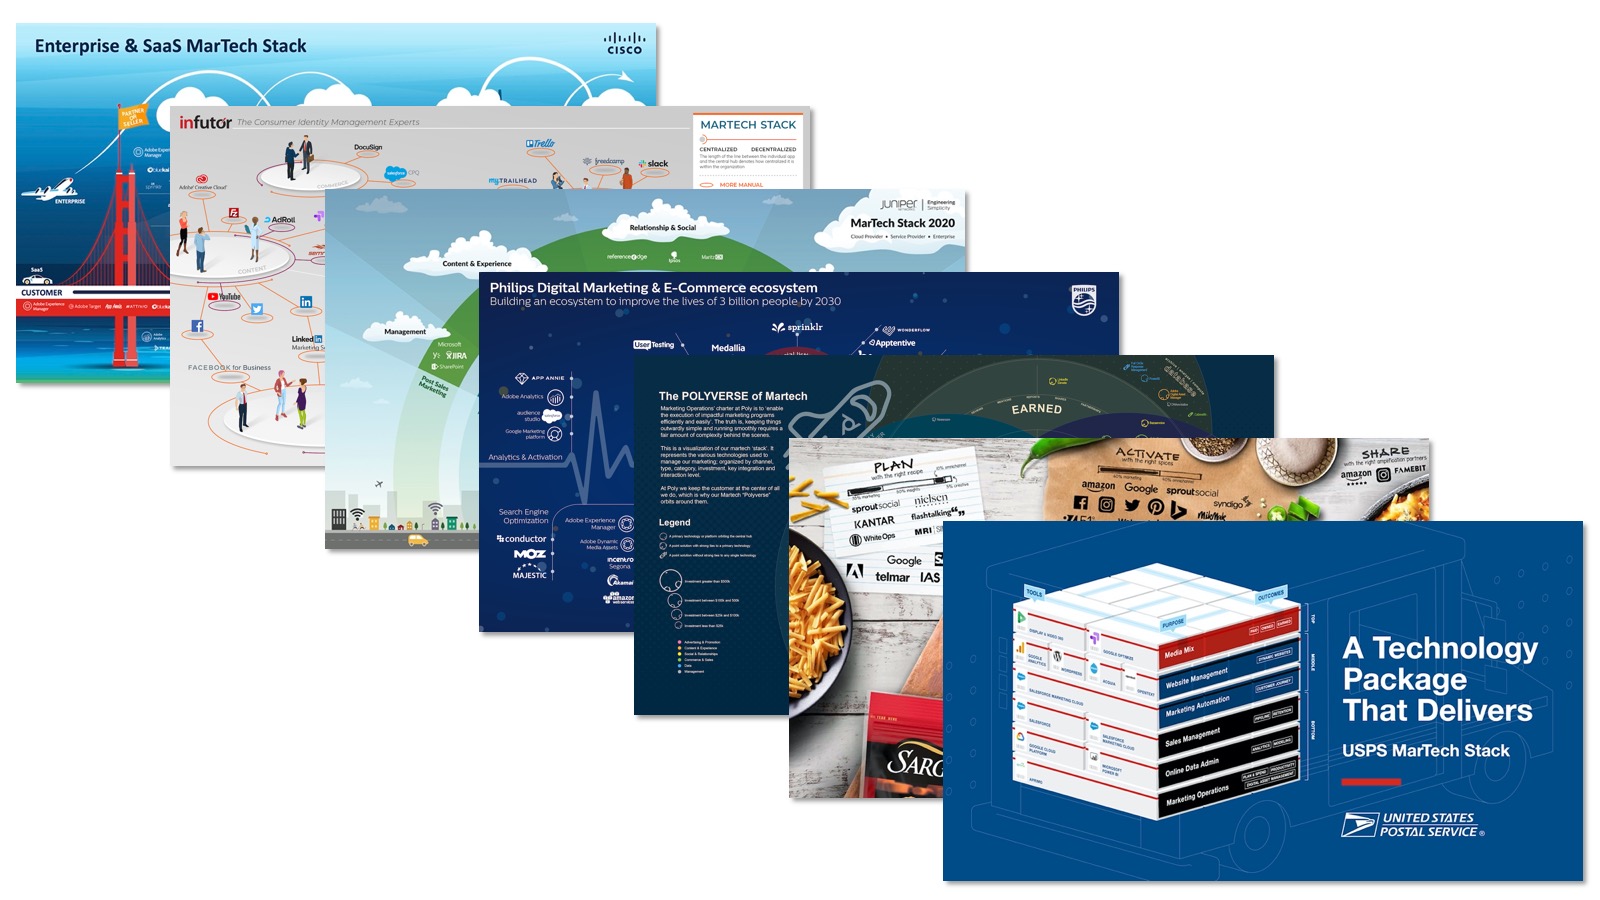
Here are seven more that provide a fascinating look into the ways marketing teams at major companies think about their stacks…
(Pro tip: you’ll want to click on the images below to view at full-size.)
Cisco Marketing Stack
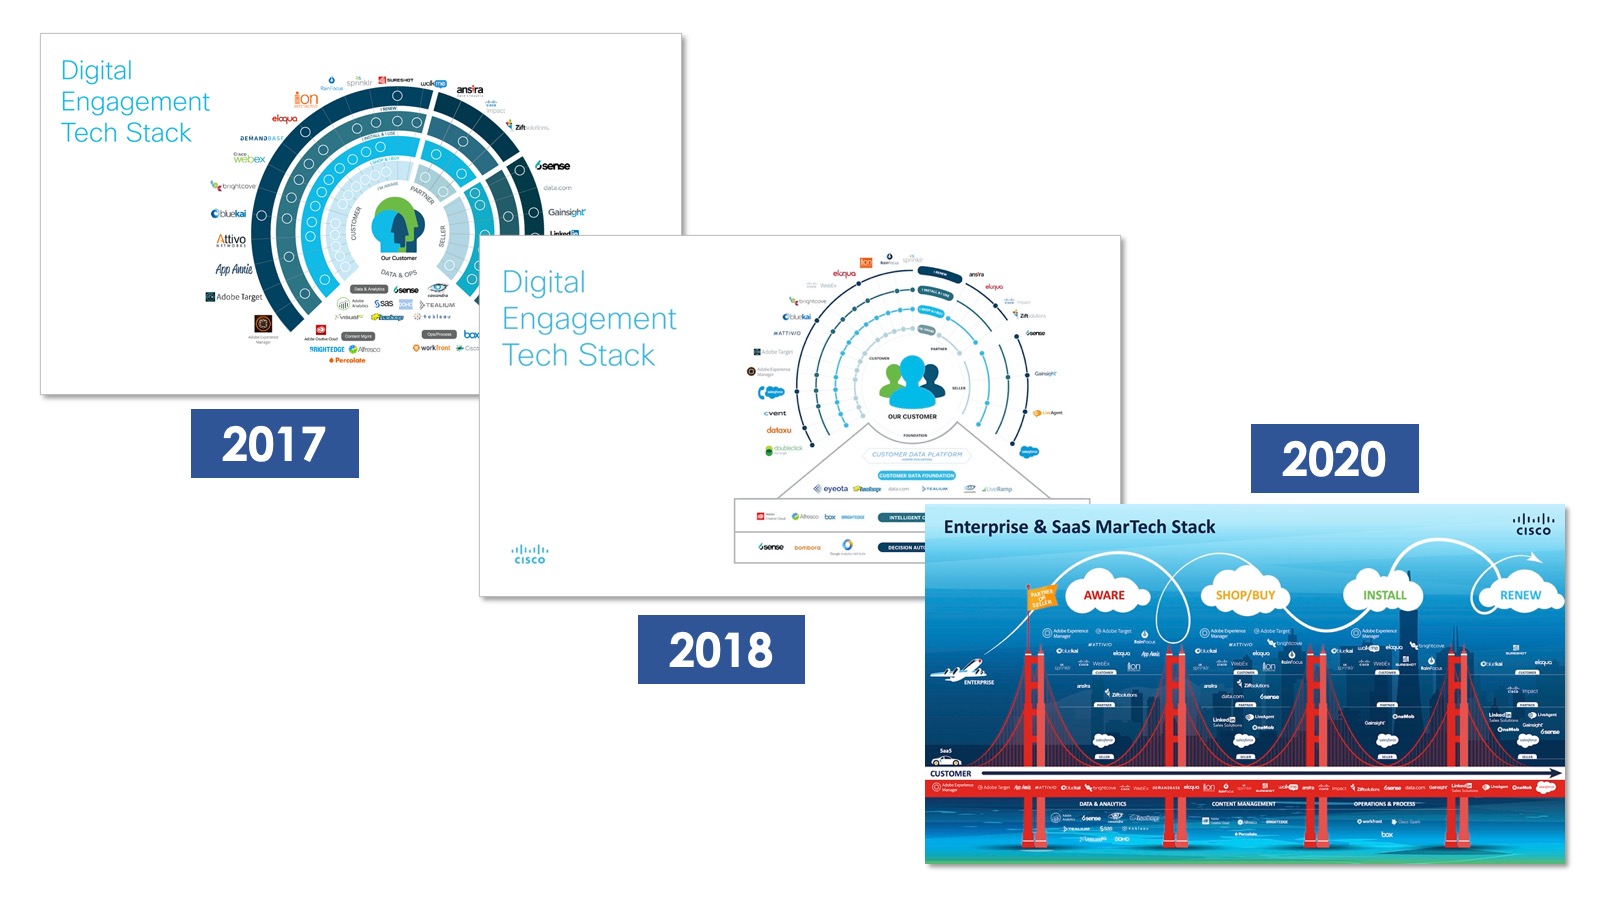
Cisco has been generously supporting The Stackies for many years. They contributed their stack visualization in 2017 and 2018. As one of the world’s biggest tech brands to share their stack, it really helped encourage other major brands to contribute. I’m incredibly grateful to them for leading the way.
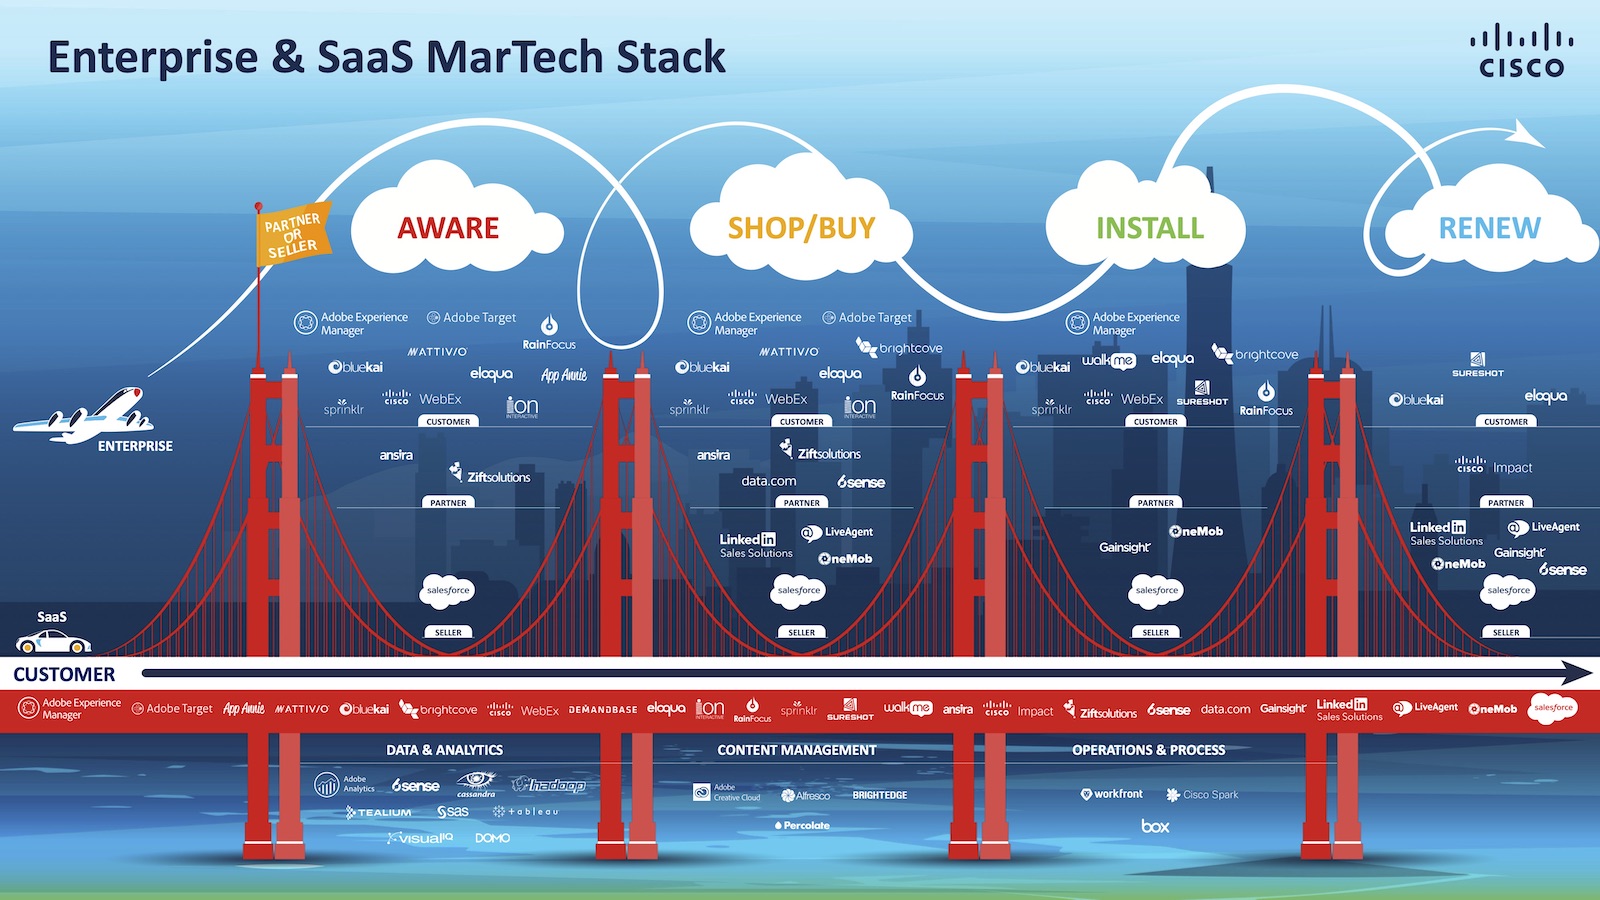
And now they’re back in 2020 with their Enterprise & SaaS MarTech Stack.
You’ve got to zoom into the large version, but you’ll be rewarded with a rich visualization that shows how a customer progresses along their journey, from left to right, through the stages of AWARE, SHOP/BUY, INSTALL, and RENEW. I love this full customer lifcycle view of marketing and martech — closing the deal is just at the halfway mark.
The bridge is made up of their primary toolset. Above the bridge they have categories for tools that primarily help the seller (Cisco), the partner (they have robust channel sales), and most of all the customer at each stage. Below the bridge are technologies that are used across the entire journey for DATA & ANALYTICS, CONTENT MANAGEMENT, and OPERATIONS & PROCESS.
Fantastic stack, Cisco. Thank you for sharing!
Infutor Marketing Stack
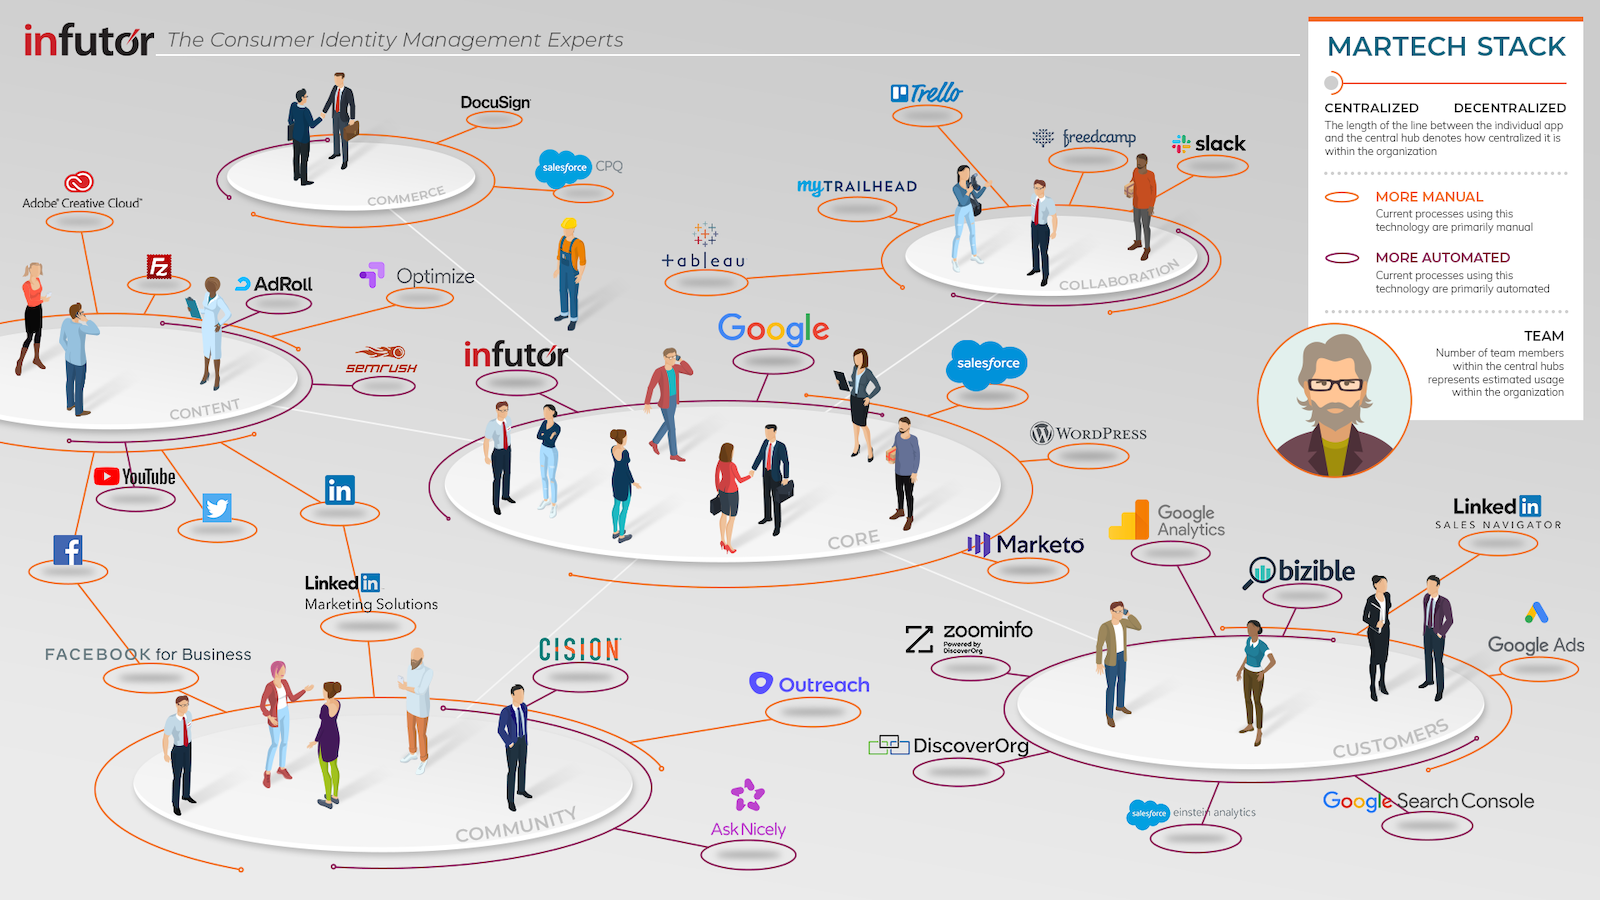
A few years ago, I sketched out a model for organizing a martech stack around the “6 C’s”: customers, content, commerce, community, core, and collaboration. I’ve nudged people in our call-for-entries to The Stackies to take a pass at illustrating one with that concept.
The good folks at Infutor, a consumer identity management company, took up the challenge and delivered. Not only did they visualize their stack around the 6 C’s, they incorporated three other layers of information in their design:
- The distance of tools from their hub represent the degree to which they are more centralized or decentralized — closer or further out — a favorite theme of mine.
- The color of the spokes, orange or purple, indicates whether the use of the tool is more manual or automated.
- And the number of people in each of the 6C hubs estimates the relative amount of usage.
I’m just taking a guess here, but the blurred out labels in the circles associated with each tool might be the person primarily responsible for the tool? If so, it would be seriously cool to know this visualization was used for helping people inside the company navigate their stack too.
Bravo, Infutor, bravo.
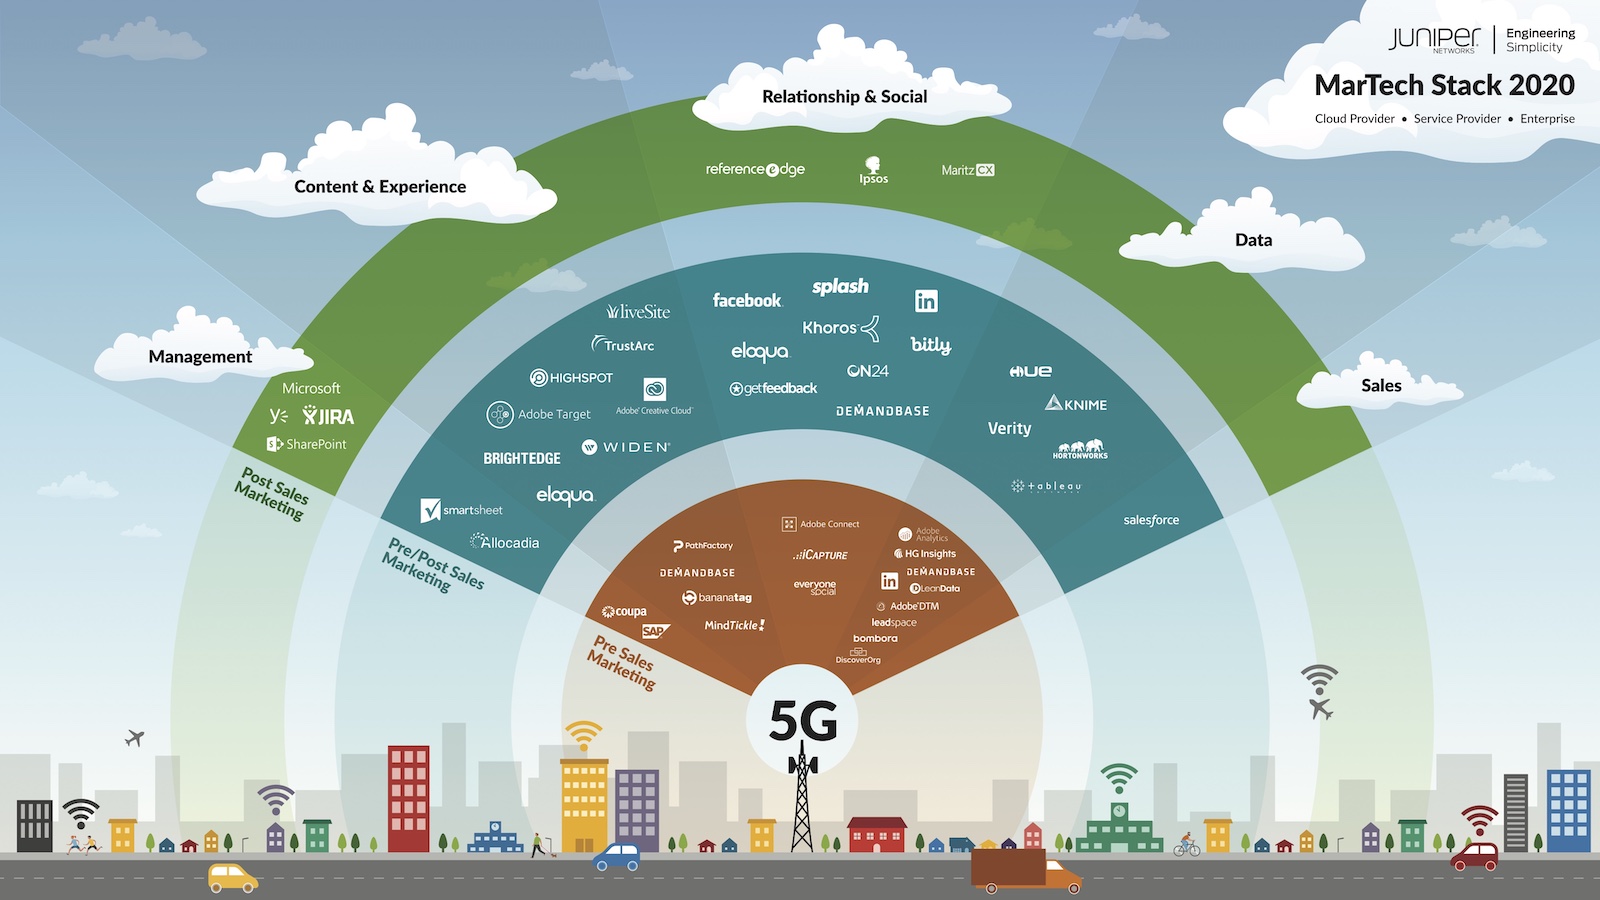
Juniper Networks Marketing Stack
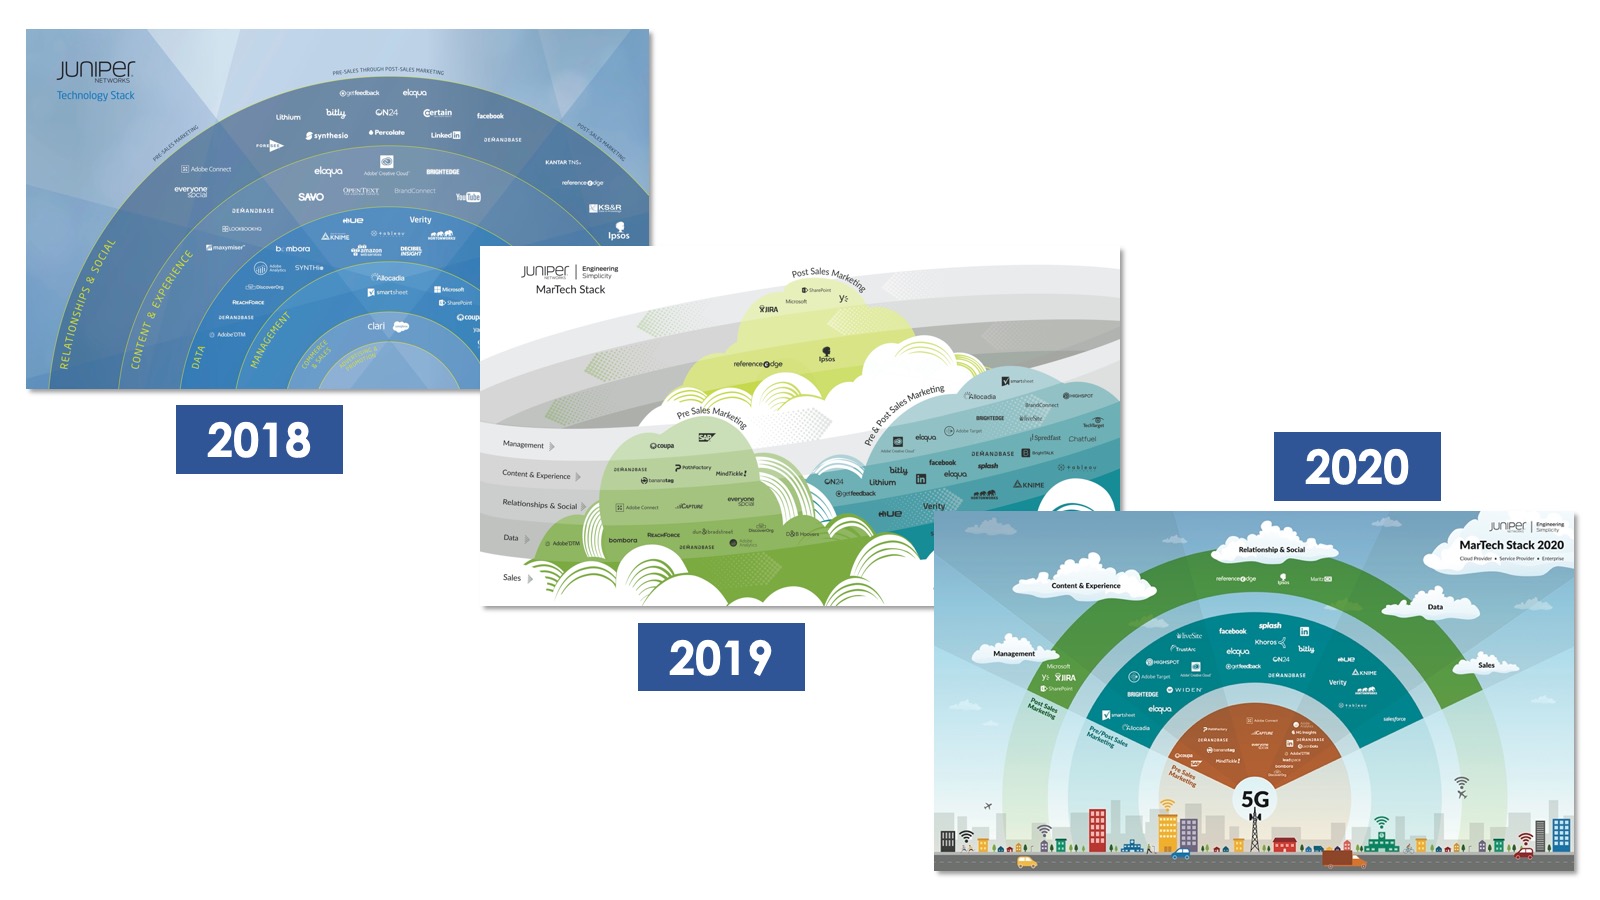
Juniper Networks, a leader in networking and cybersecurity solutions, has been another one of our repeat contributors. This is the third year in a row that they have shared their stack with us. Check out their excellent 2018 and 2019 entries.
My heart is filled with love for them for not only transparently sharing their stack with the martech community, but especially for giving us a year-over-year view into its evolution.
Their entry this year is a further iteration of the same underlying design: a two-dimensional stack that organizes marketing technologies along two axes:
- The stage of the customer journey in which the tool is applied: pre-sales marketing, pre- and post-sales marketing, and post-sales marketing.
- The category on the marketing technology landscape in which the tool is grouped.
An intuitive and easy to read illustration of an enterprise stack. Thank you again, Juniper!
P.S. Nice job embedding the 5G branding in your graphic.
Philips Marketing Stack
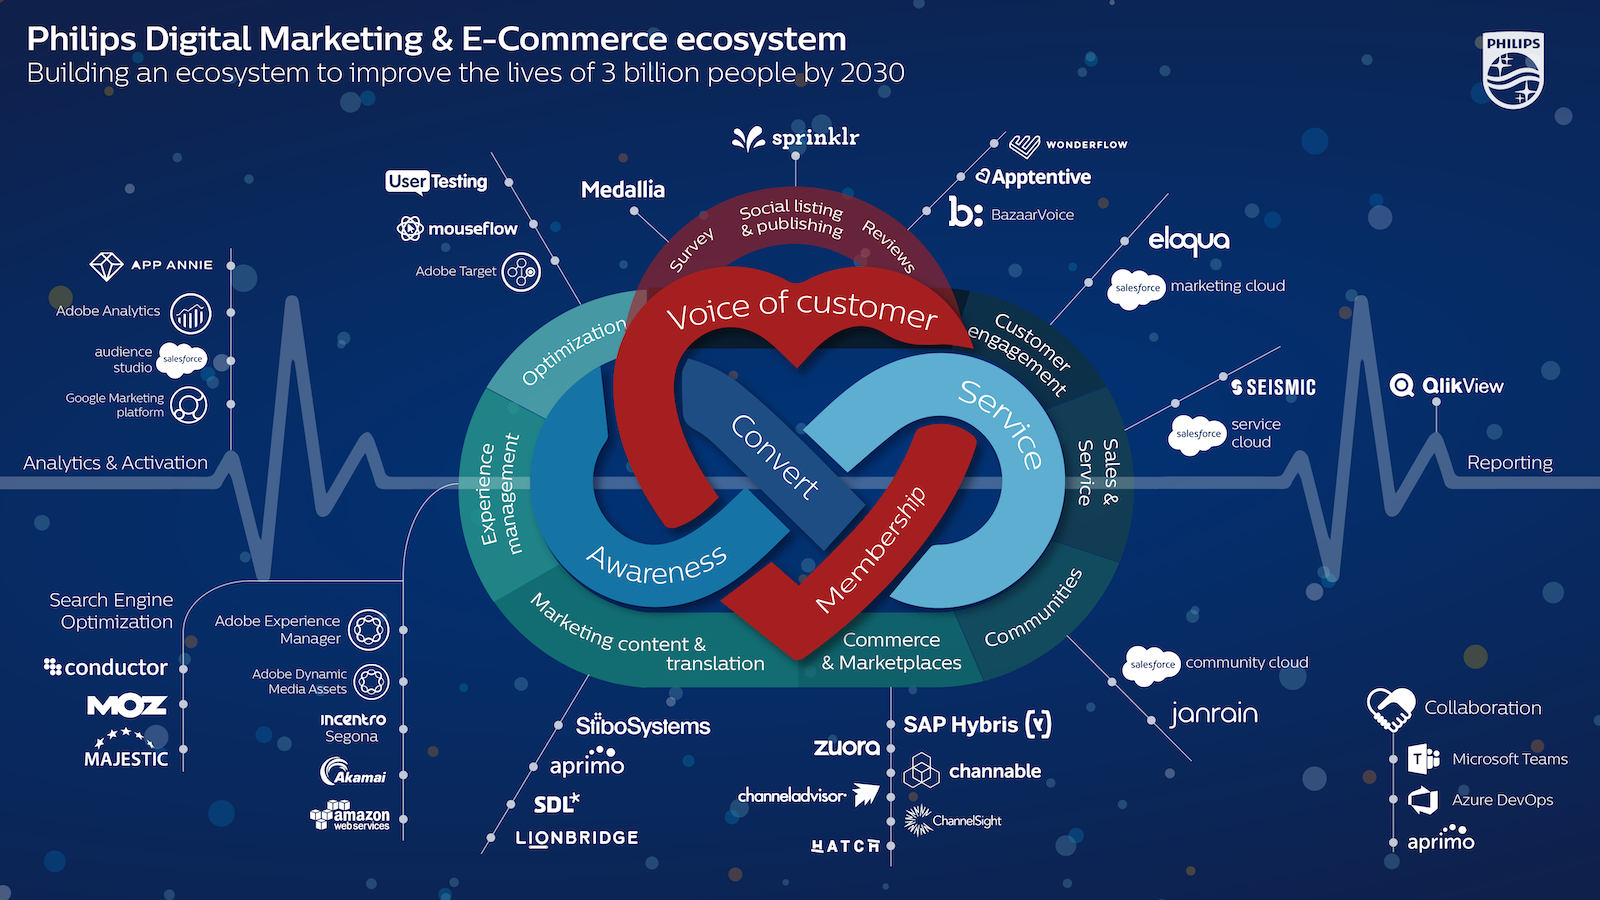
The most beautiful stack visualization this year may be this one from Philips. It’s hard to do justice in mere words to the Philips Digital Marketing & E-Commerce Ecosystem graphic — love the name, by the way. You really have to open up the full-screen image and just dive into it.
The voice of the customer is at the heart of their stack. It’s literally illustrated as a heart. It’s connected to three core marketing capabilities for surveys, social listing & publishing, and reviews. Specific tools branch out from each of those capabilities.
Entwined within the heart is the infinite customer lifecycle of awareness, conversion, and service. Connected around that center are marketing capabilities:
- Optimization
- Experience management
- Marketing content & translation
- Commerce & marketplaces
- Communities
- Sales & service
- Customer engagement
Supporting technologies are clustered on the edges:
- Analytics & activation
- Collaboration
- Reporting
This is a work of art, Philips. Thank you so much for sharing it.
Poly Marketing Stack
Every year there’s at one least one entry that embodies a PhD in marketing stacks. This year, Poly, a leading manufacturer of communications and video conferencing solutions, knocks it out of the park with their visualization.
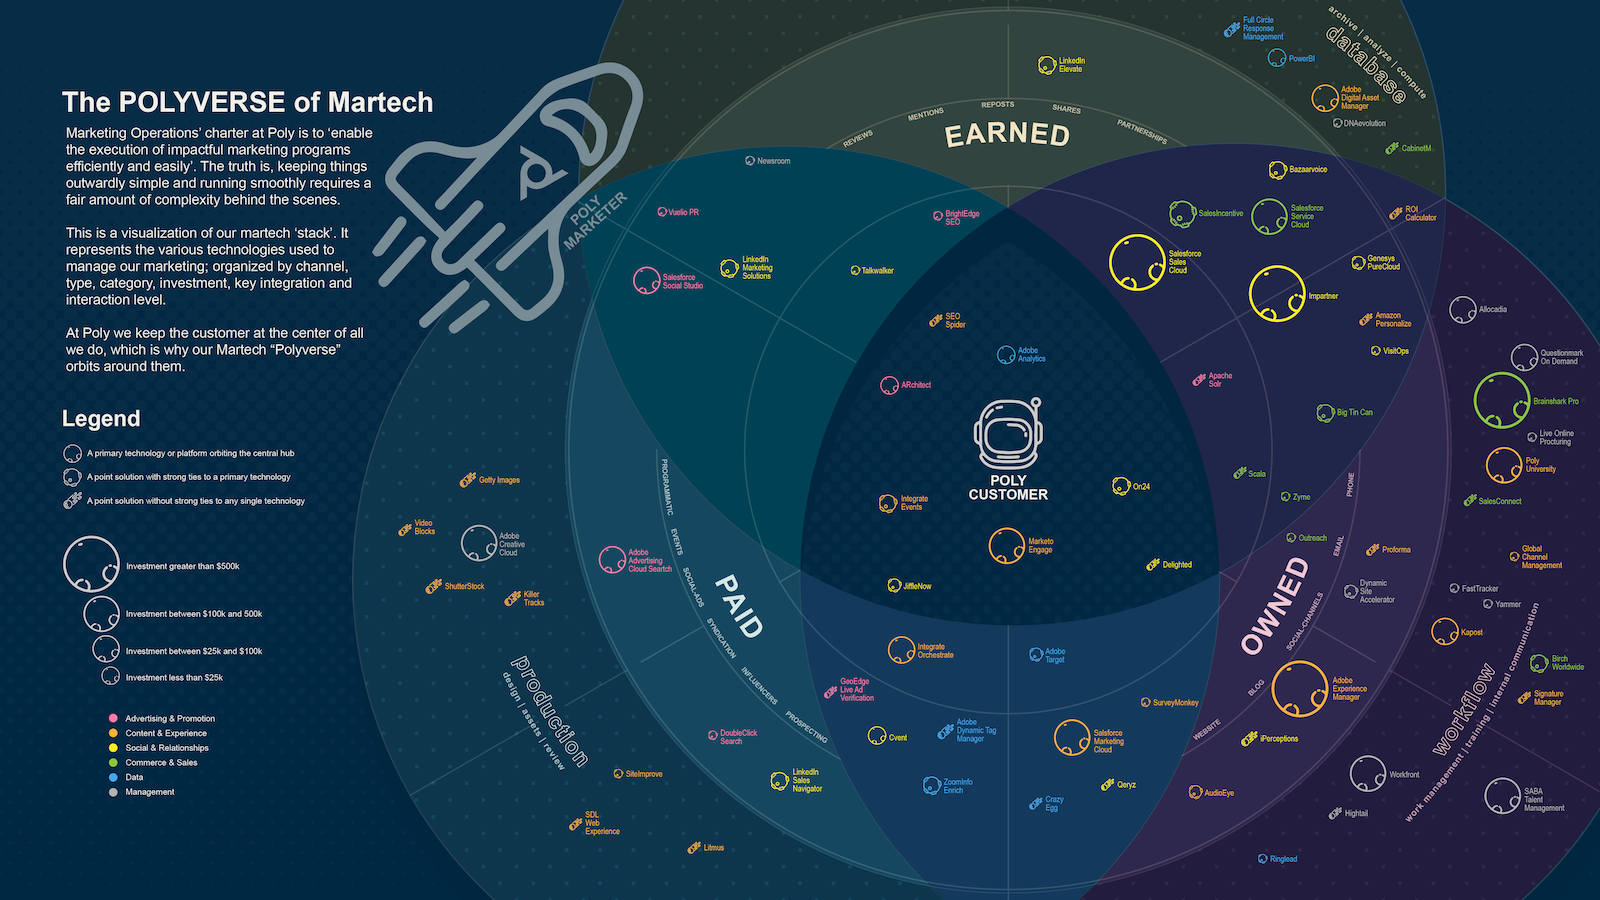
You really do have to zoom into The POLYVERSE of Martech to be able to read what’s going on here, but there’s a ton of insight you can unpack when you do.
The “universe” of Poly’s marketing stack revolves around the customer at the center. Around the customer is a segmented band of PAID, OWNED, and EARNED marketing channels:
- PAID: programmatic, events, social ads, syndication, influencers, prospecting
- OWNED: website, blog, social channels, email, phone
- EARNED: reviews, mentions, reports, shares, partnerships
Overlaying that band is a Venn diagram of three overlapping circles of capabilities:
- DATABASE: archive, analyze, compute
- PRODUCTION: design, assets, review
- WORKFLOW: work management, training, internal communication
Across this background, they’ve placed the martech tools they use in orbits that somehow perfectly fit in that two-dimensional map of channels and capabilities. But, wait, there’s more. They represented three additional dimensions to their stack on top of that:
- PRODUCT INTEGRATION: The martech tools in their stack have one of three shapes: (A) a primary technology or platforming orbiting the central hub; (B) a point solution with strong ties to a primary technology; or (C) a point solution without strong ties to any single technology. You’re seeing martech platform ecosystems in their natural habitat here.
- PRODUCT INVESTMENT: The size of the shape is proportional to the investment in it, ranging from solutions that were less than $25K up to solutions that were greater than $500K. While none of those costs will come as a surprise when you look at the specific tools, Poly’s willingness to share this as a dimension of their stack is impressive — and it adds a super helpful dimension to understanding the nature of an enterprise marketing stack like this.
- PRODUCT CATEGORY: And last, but not least, they’ve color-coded each tool by its category on the marketing technology landscape.
I could seriously spend a whole evening just pouring through this one illustration. This is a truly masterful piece of work, Poly, and an incredible contribution to the martech community. Thank you!
Sargento Marketing Stack
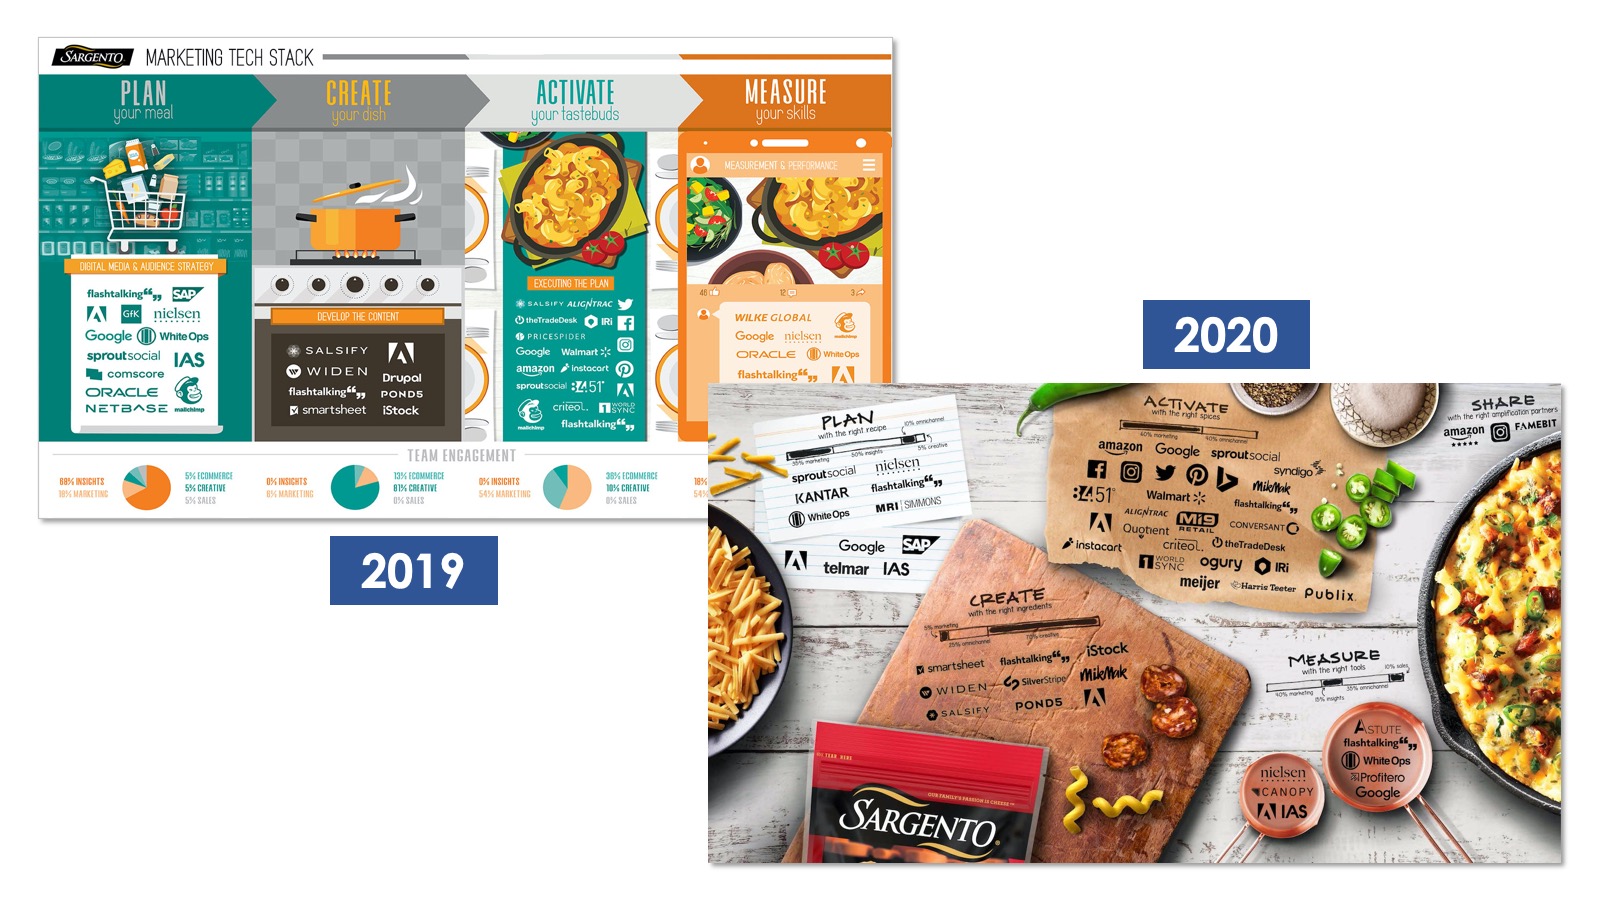
We tend to get a lot of tech companies that contribute to The Stackies. That’s great, but I also crave examples of how marketing stacks from non-tech industries are assembled. So I am especially grateful that Sargento has become a two-time contributor to The Stackies. Their entry in 2019 was one of last year’s winners.
They kept the same organization for their stack visualization this year, clustering tools by their stage in marketing’s workflow: PLAN, CREATE, ACTIVATE, MEASURE, and SHARE. Within each of those first four stages, they include an estimate of the relative engagement of different teams in that stage: marketing, insights, creative, omnichannel, and sales.
It’s fascinating to see the tools in each of these stages. There’s some overlap with products you’d expect to see in any marketing stack. But there are many that are much more specific to their market and channel structure. You can appreciate why there is specialization in the martech landscape. I love the (implied) integrations with retailers such as Instacart, Harris Teeter, Meijer, Publix, etc.
Brand-wise, their visualization is pretty next level too. Look closer — it’s not just a cool kitchen background. You’ve got recipe cards for PLAN. A cutting board for CREATE. Wrapping paper for ACTIVATE. Different sized copper tins for MEASURE. Well-played.
Thank you, Sargento. I want you to know I smile every time I see you in the dairy aisle.
USPS Marketing Stack
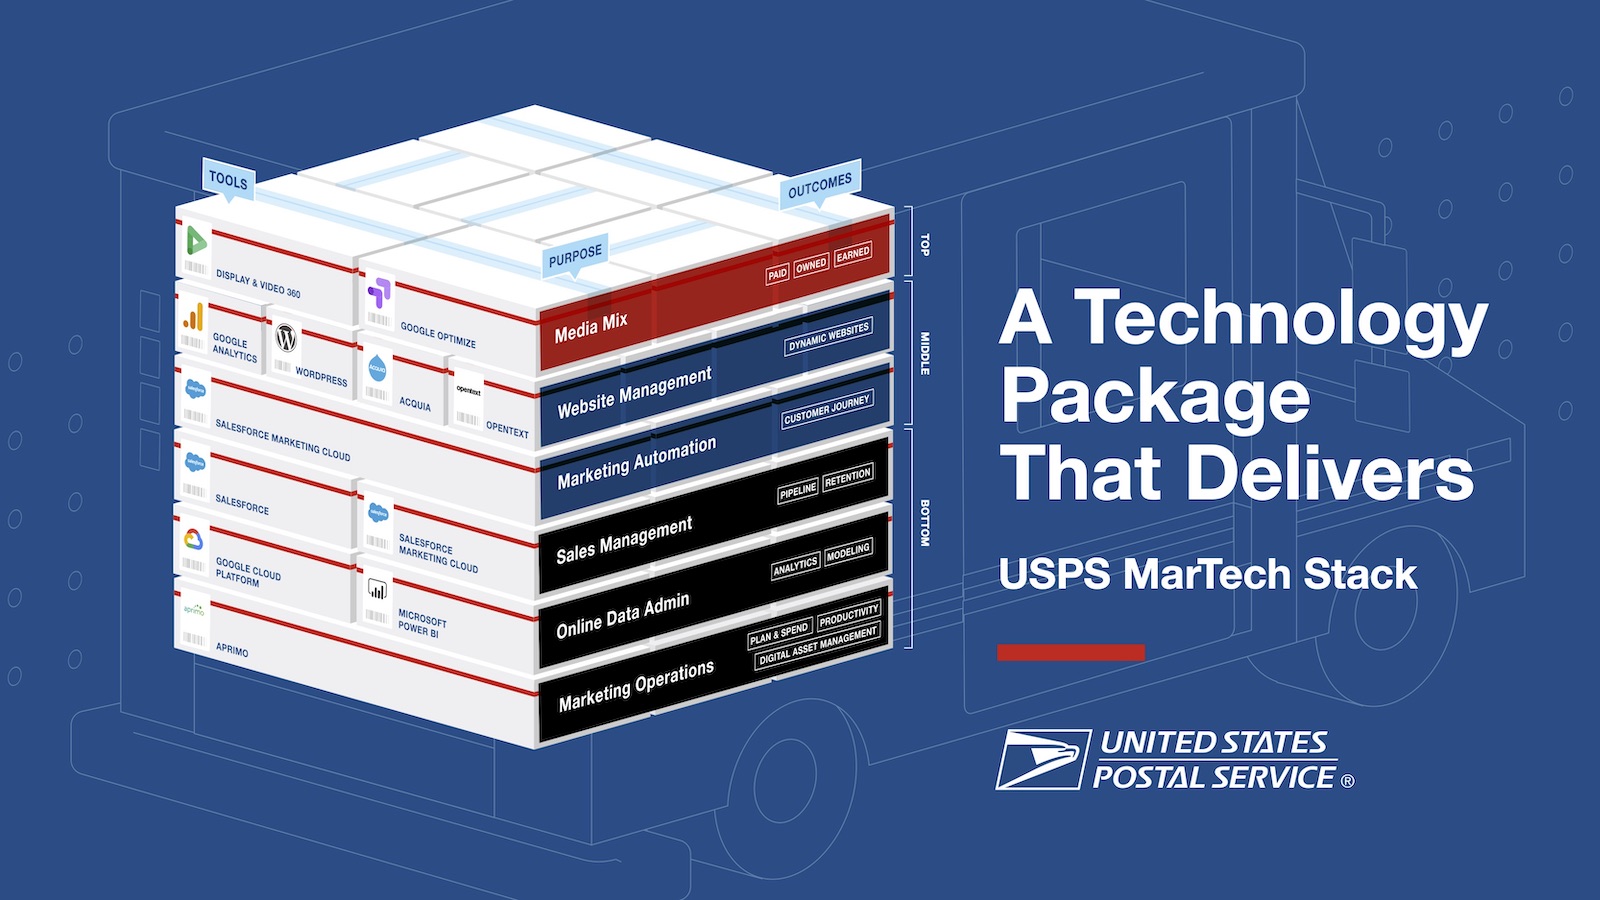
And to round out this tour of seven amazing martech stacks, I’m thrilled to share with you an entry from the United States Postal Service (USPS for short). This is the first entry ever from a government agency, which is pretty awesome.
Of course, the postal service is also a business, and they’ve built a marketing stack to support it. This illustration organizes their stack in three dimensions: tools, purpose, and outcomes, with a top-to-bottom flow that I interpret as the flow from top-of-funnel to bottom-of-funnel marketing activities.
All wrapped up in a nice, neat package. I definitely give it my stamp of approval.
Enter Your Stack in The Stackies by September 18
Hopefully you’ve found the stacks above to be educational and inspiring. I am so appreciative of everyone who contributes to The Stackies. All these different examples help us better understand the structure and nature of marketing stacks.
If you appreciate these as much as I do, here’s your chance to pay it forward. Enter your own stack in The Stackies before September 18. Click through on that link for details, but there’s no cost to enter — in fact, we donate to charity on behalf of contributors who enter — and there are a ton of side benefits you can get from participating:
We’d love to have you be a part of the celebration of The Stackies in the fall.
